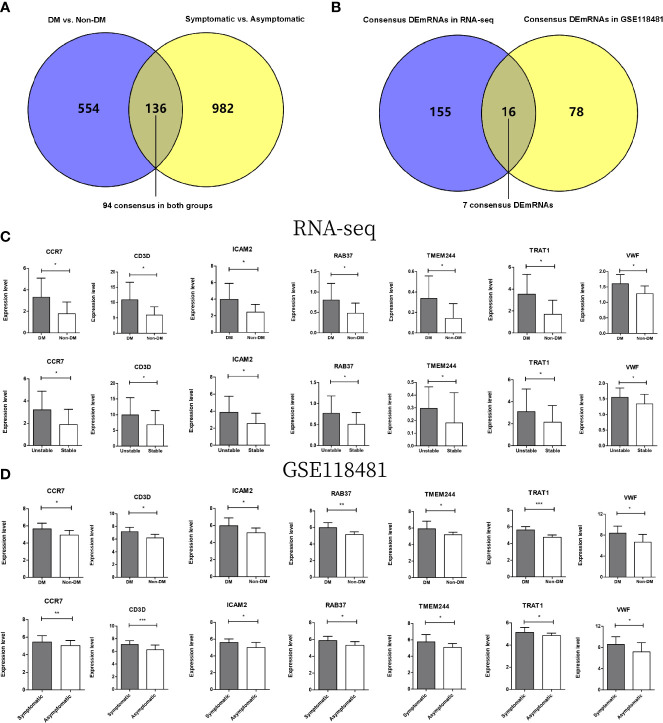
Figure 6.
(A) Wayne diagram for comparison of significantly differentially expressed genes in DMs versus non-DM and symptomatic versus asymptomatic groups in GSE118481 datasets. (B) Wayne diagram comparing overlapping genes in DM versus non-DM and stable versus unstable groups with target mRNA in RNA-seq data results. (C) The expression levels of 7 genes were distributed in two comparison groups in the RNA-seq data. (D) The expression levels of 7 genes were distributed in two comparison groups in the GSE118481 dataset. * indicates p<0.05, * * indicates p<0.01, * * * indicates p<0.001.

