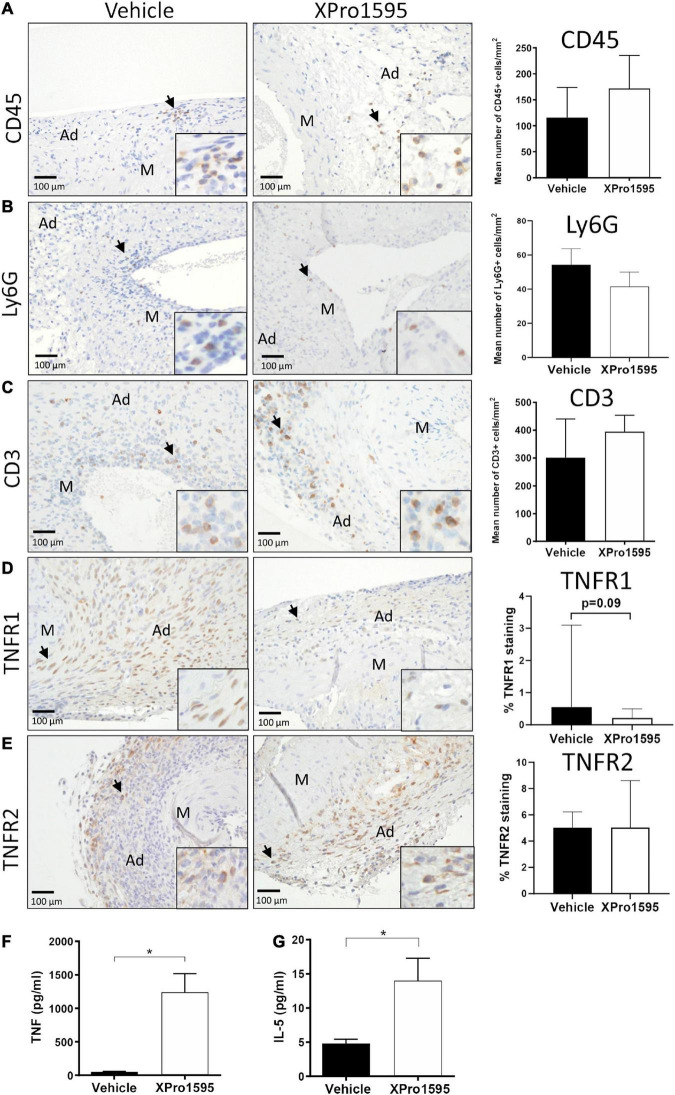
FIGURE 7.
Characterization of aneurysm wall composition after inhibition of solTNF in ANGII-induced abdominal aortic aneurysms. Representative micrographs of CD45-positive leukocytes (A), Ly6G-positive neutrophils (B), CD3-positive T cells (C) (n = 13), TNFR1 localization (D), TNFR2 localization (E) (n = 6) and their respective semi-quantification (number of positive cells/mm2 or % positive staining) in cross-sections of ANGII-induced AAA treated with vehicle or XPro1595 (2 mg/kg). Black arrows point to examples of positive stained cells. Circulating TNF plasma levels (n = 4–5) (F) and IL-5 (n = 6–7) (G) in ANGII-induced AAA treated with vehicle or XPro1595. Data are shown as mean SEM if data passed the D’Agostino and Pearson omnibus normality tests (B,C,E–G). *Denotes p < 0.05 analyzed by unpaired Student’s t-test for normally distributed data, otherwise by Mann-Whitney test represented as median with interquartile range (A,D). M, media; Ad, adventitia.

