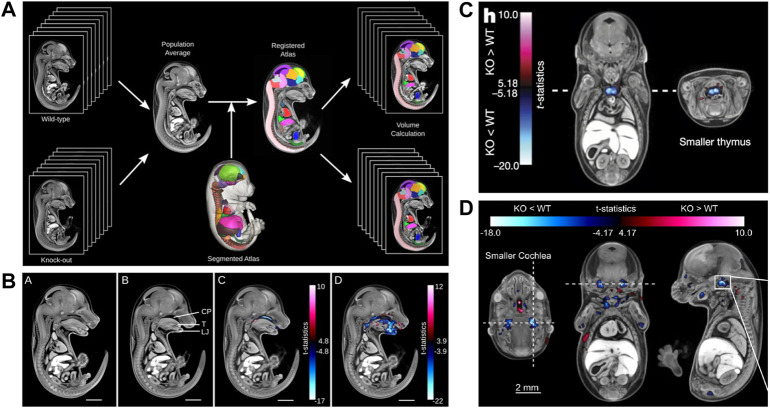
FIGURE 7.
MicroCT for automated detection of novel phenotypes. (A) Automated image analysis pipeline using a microCT data-derived segmented mouse embryo atlas to detect developmental malformations [Figure 2 from Wong et al., 2014, Development 141 (12)]. (B) Automated detection of gross phenotypes by intensity- and deformation-based analysis in Satb2 knockout mice (Figure 6 from Wong et al., 2014, Development 141 (12)). (C) Automated detection of subtle phenotypes, demonstrated on small thymus volume in E15.5 Cbx4 knockout mice (parts of Figure3H from Dickinson et al., 2016, Nature 537). (D) Automated detection of subtle phenotypes, demonstrated on small cochlear volume in E15.5 Eya4 mutant embryos (Extended Data Figure 6D from Dickinson et al., 2016, Nature 537). A and B reprinted by permission from the Company of Biologists. C and D reprinted by permission from Springer Nature.

