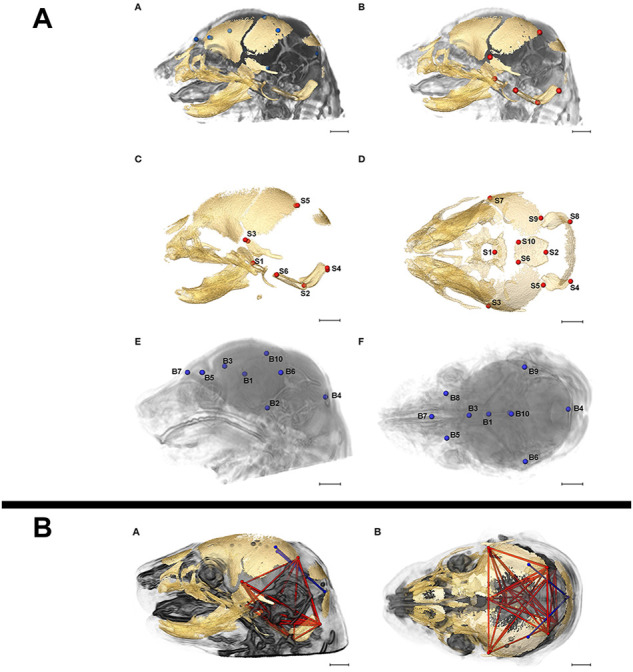
FIGURE 8.

Correlative imaging of mouse embryos with microCT and MRI. (A) Skull and brain landmarks set on co-registered microCT and high-resolution MRI data sets. The inter-landmark distances are used in a PCA analysis to assess the integration of skull and brain development. MicroCT reveals bone structure, MRI retrieves brain morphology in formaldehyde-fixed but otherwise uncontrasted E17.5 mouse embryos (Figure 2 from Motch Perrine et al., 2017, Frontiers in Human Neuroscience 11). (B) Brain (blue) and skull (red) linear distances with statistically significant different association between Fgfr2c C342Y/+ Crouzon syndrome mice and Fgfr2 +/S252W Apert syndrome mice at E17.5 (Figure 6 from Motch Perrine et al., 2017, Frontiers in Human Neuroscience 11). All images reprinted under the terms of the Creative Commons Attribution License.
