FIGURE 5.

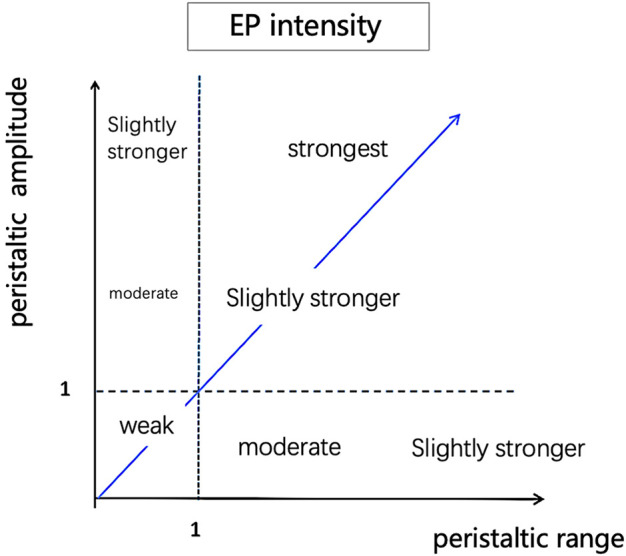
Quantitative assessment of EP intensity. Calculate each peak on the peristaltic wave curve and generate a point with peristaltic range on the x-axis and peristaltic amplitude on the y-axis in the coordinate system.

Quantitative assessment of EP intensity. Calculate each peak on the peristaltic wave curve and generate a point with peristaltic range on the x-axis and peristaltic amplitude on the y-axis in the coordinate system.