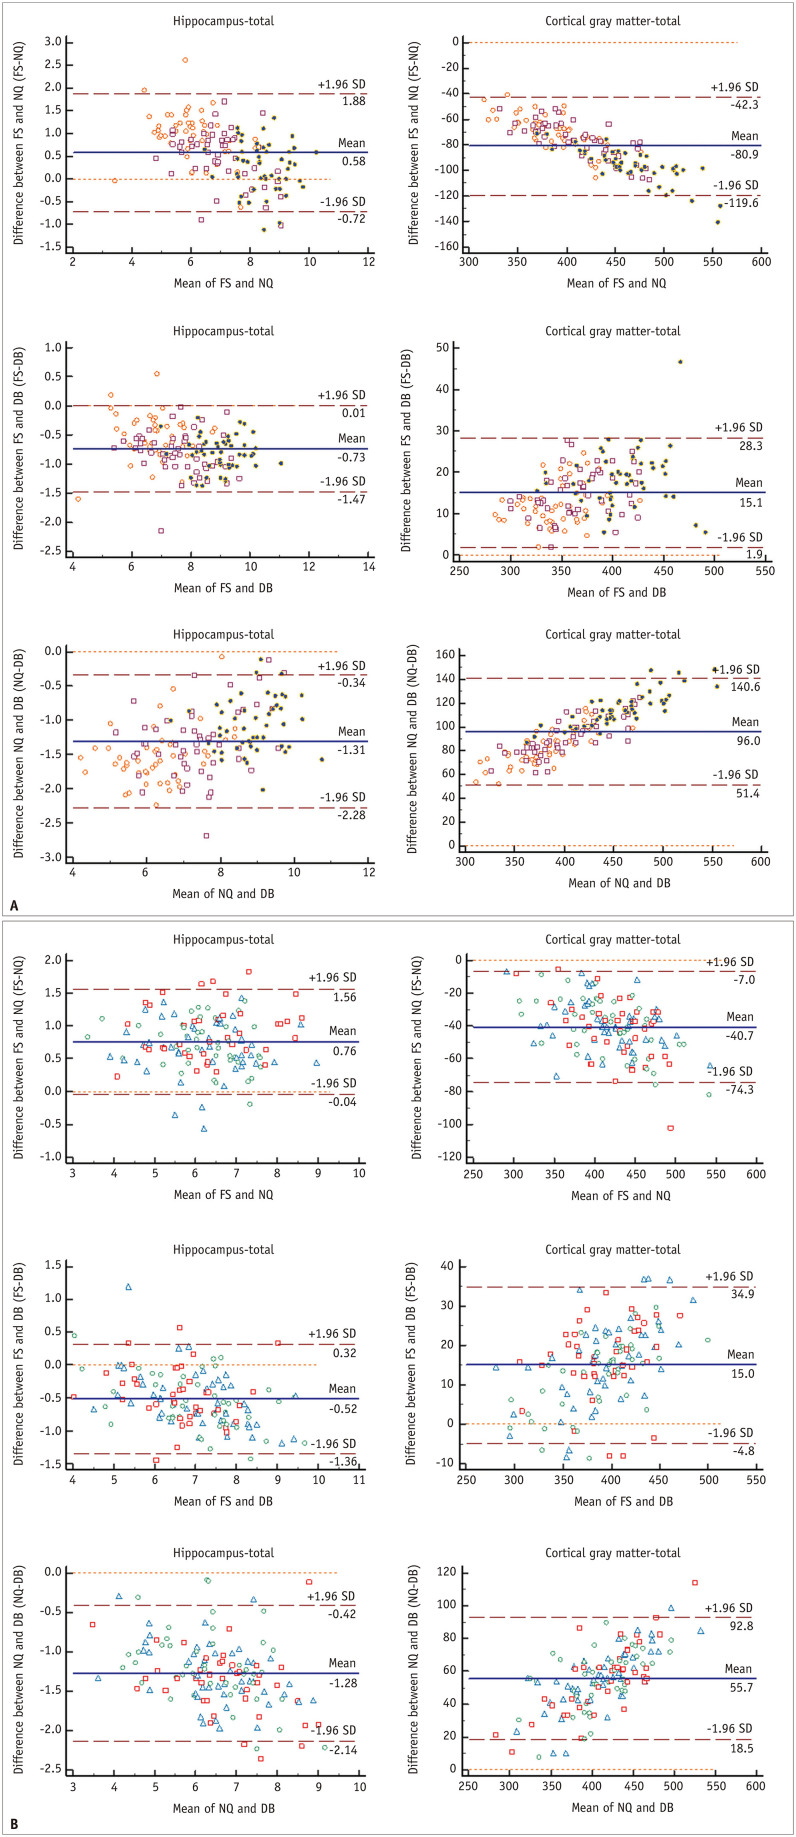
Fig. 4. Bland–Altman plots for agreement between each software for regional brain volume.
A, B. Represent SMC and ADNI data, respectively. The units for both the x- and y-axes are cm3. There is a tendency for NQ to overestimate large volumes and underestimate small volumes compared with FS measurement of cerebral cortical GM in both SMC (A) and ADNI data (B). In contrast, DeepBrain slightly tends to underestimate large volumes and overestimate small volumes compared with FS measurement of the cerebral cortical GM in both A and B. The orange circle, brown square, and purple circle in A indicate the Alzheimer’s disease, mild cognitive impairment, and normal elderly subgroups, respectively. The blue triangle, red square, and green circle in B indicate the 1.5T Siemens, 3T GE, and 3T Phillips subgroups, respectively. The brown horizontal dashed lines delineate the 95% confidence intervals (the likelihood of individual measures to be within ± 1.96 SDs). The orange horizontal dashed line represents the equal (the difference between two software measurements is zero) line. The blue horizontal line indicates the difference between two software measurements. ADNI = Alzheimer’s Disease Neuroimaging Initiative, DB = DeepBrain, FS = FreeSurfer, GM = gray matter, NQ = NeuroQuant, SD = standard deviation, SMC = single medical center

