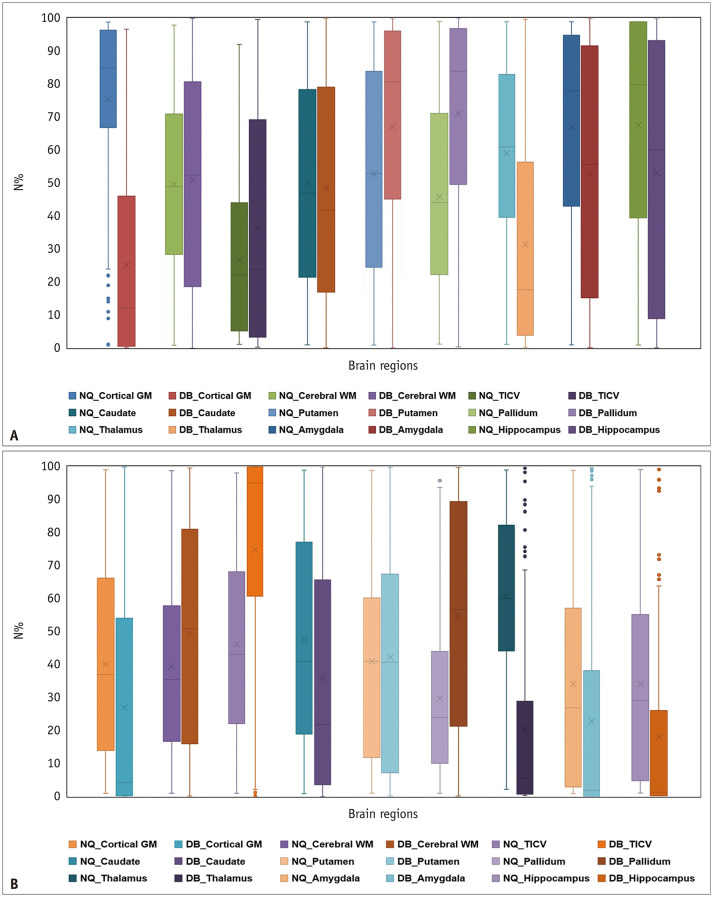
Fig. 5. Box-and-whisker plots showing differences in N% of regional brain volume derived from NQ and DB.
A, B. Represent N% of the single medical center and ADNI data, respectively. The lines inside the boxes and the lower and upper boundary lines represent the median, 25th, and 75th percentile values, respectively, with whiskers extending from the median to ± 1.5 × the interquartile range; outliers beyond the whiskers are represented by points. ADNI = Alzheimer’s Disease Neuroimaging Initiative, DB = DeepBrain, GM = gray matter, NQ = NeuroQuant, N% = normative percentiles, TICV = total intracranial volume, WM = white matter

