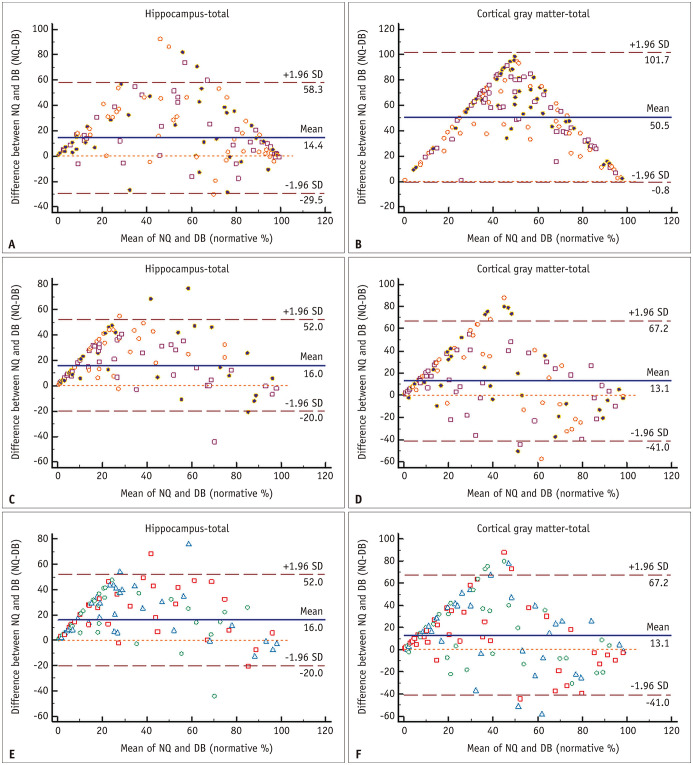
Fig. 6. Bland-Altman plots for agreement of the normative percentile of the hippocampus (A, C, E) and cortical gray matter (B, D, F) between NQ and DB.
A-F. A and B represent SMC data, and C-F represent ADNI data. There is a tendency of a triangular or rhomboid shape on the Bland–Altman plot with unacceptably broad limits of agreement for all datasets. In A-D, the orange circle, brown square, and purple circle indicate the Alzheimer’s disease, MCI, and NL control subgroups, respectively, in both datasets. In E and F, the blue triangle, red square, and green circle indicate the 1.5T Siemens, 3T GE, and 3T Phillips subgroups, respectively. The brown horizontal dashed lines delineate the 95% confidence intervals (the likelihood of individual measures to be within ± 1.96 SDs). The orange horizontal dashed line represents the equal (the difference between two software measurements is zero) line. The blue horizontal line is the mean difference of two software measurements. ADNI = Alzheimer’s Disease Neuroimaging Initiative, DB = DeepBrain, MCI = mild cognitive impairment, NL = normal elderly participants, NQ = NeuroQuant, SD = standard deviation, SMC = single medical center

