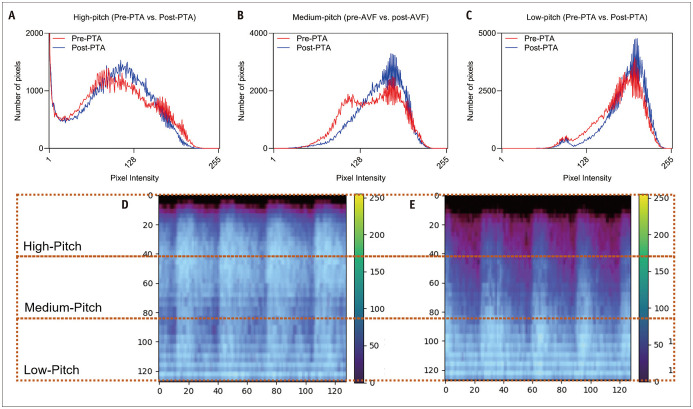
Fig. 4. Histograms showing the number of pixels at various pixel intensities at (A) high-, (B) medium-, (C) low-pitch frequencies of AVF shunt sounds before and after PTA and mel spectrograms of (D) pre-PTA and (E) post-PTA shunt sounds.
AVF = arteriovenous fistula, PTA = percutaneous transluminal angioplasty

