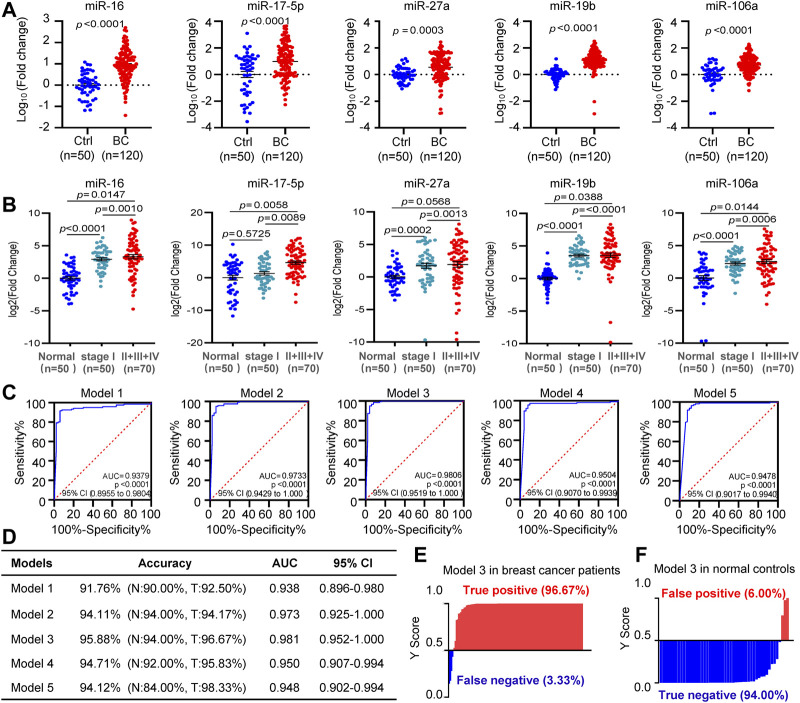
FIGURE 5.
Diagnostic model development. (A). The differential expression analysis of circulating miR-16, miR-17, miR-27a, miR-19b, and miR-106a in all the 120 BC patients and 50 controls. (B). Higher levels of circulating miR-16, miR-17, miR-27a, miR-19b, and miR-106a in patients at stages II or III or IV than that at stage I. (C), (D). ROC curves showing diagnostic accuracy, AUC and 95% CI of the five models tested in the 120 BC patients and 50 controls. (E), (F). Y score distribution plot of the miR-19b-based 3-miRNA model (model 3) in the 120 BC patients (E) and 50 normal controls (F) showing the true-positive rate (97%) in BC patients and true negative rate (94%) in normal controls. Y score>0.5 was diagnosed as BC.

