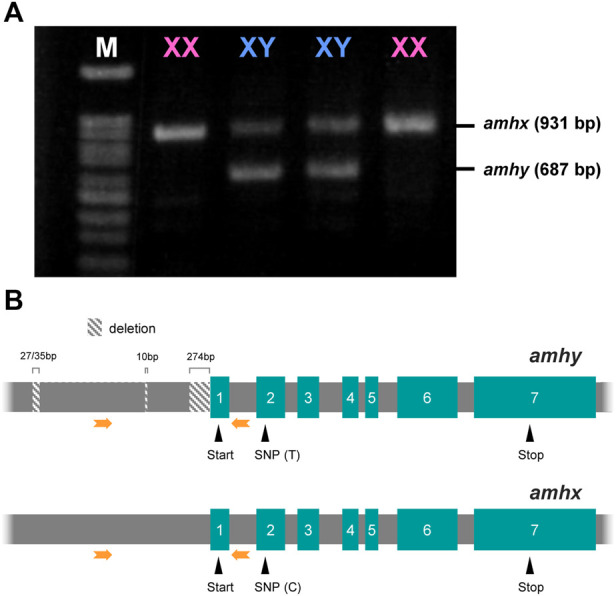
FIGURE 2.

Amplification pattern of 5′ upstream region and the structure of amhy and amhx genes in P. olivaceus. (A) Agarose gel electrophoresis of amhx and amhy 5′ upstream region amplified by PCR in XX and XY individuals, phenotypic females and males, respectively; amhy band is shorter than amhx due to deletions in the presumptive promoter. (B) Structures of amhy and amhx genes showing the position of three amhy-specific deletions in the 5′ upstream region, both start and stop codons, and a SNP in the second exon; thymine (T) and cytosine (C) in exon 2 were highly linked to amhy and amhx, respectively. Green boxes represent the exons with the respective number and grey boxes in between represent the introns. Orange arrows indicate the position of primers used in (A)
