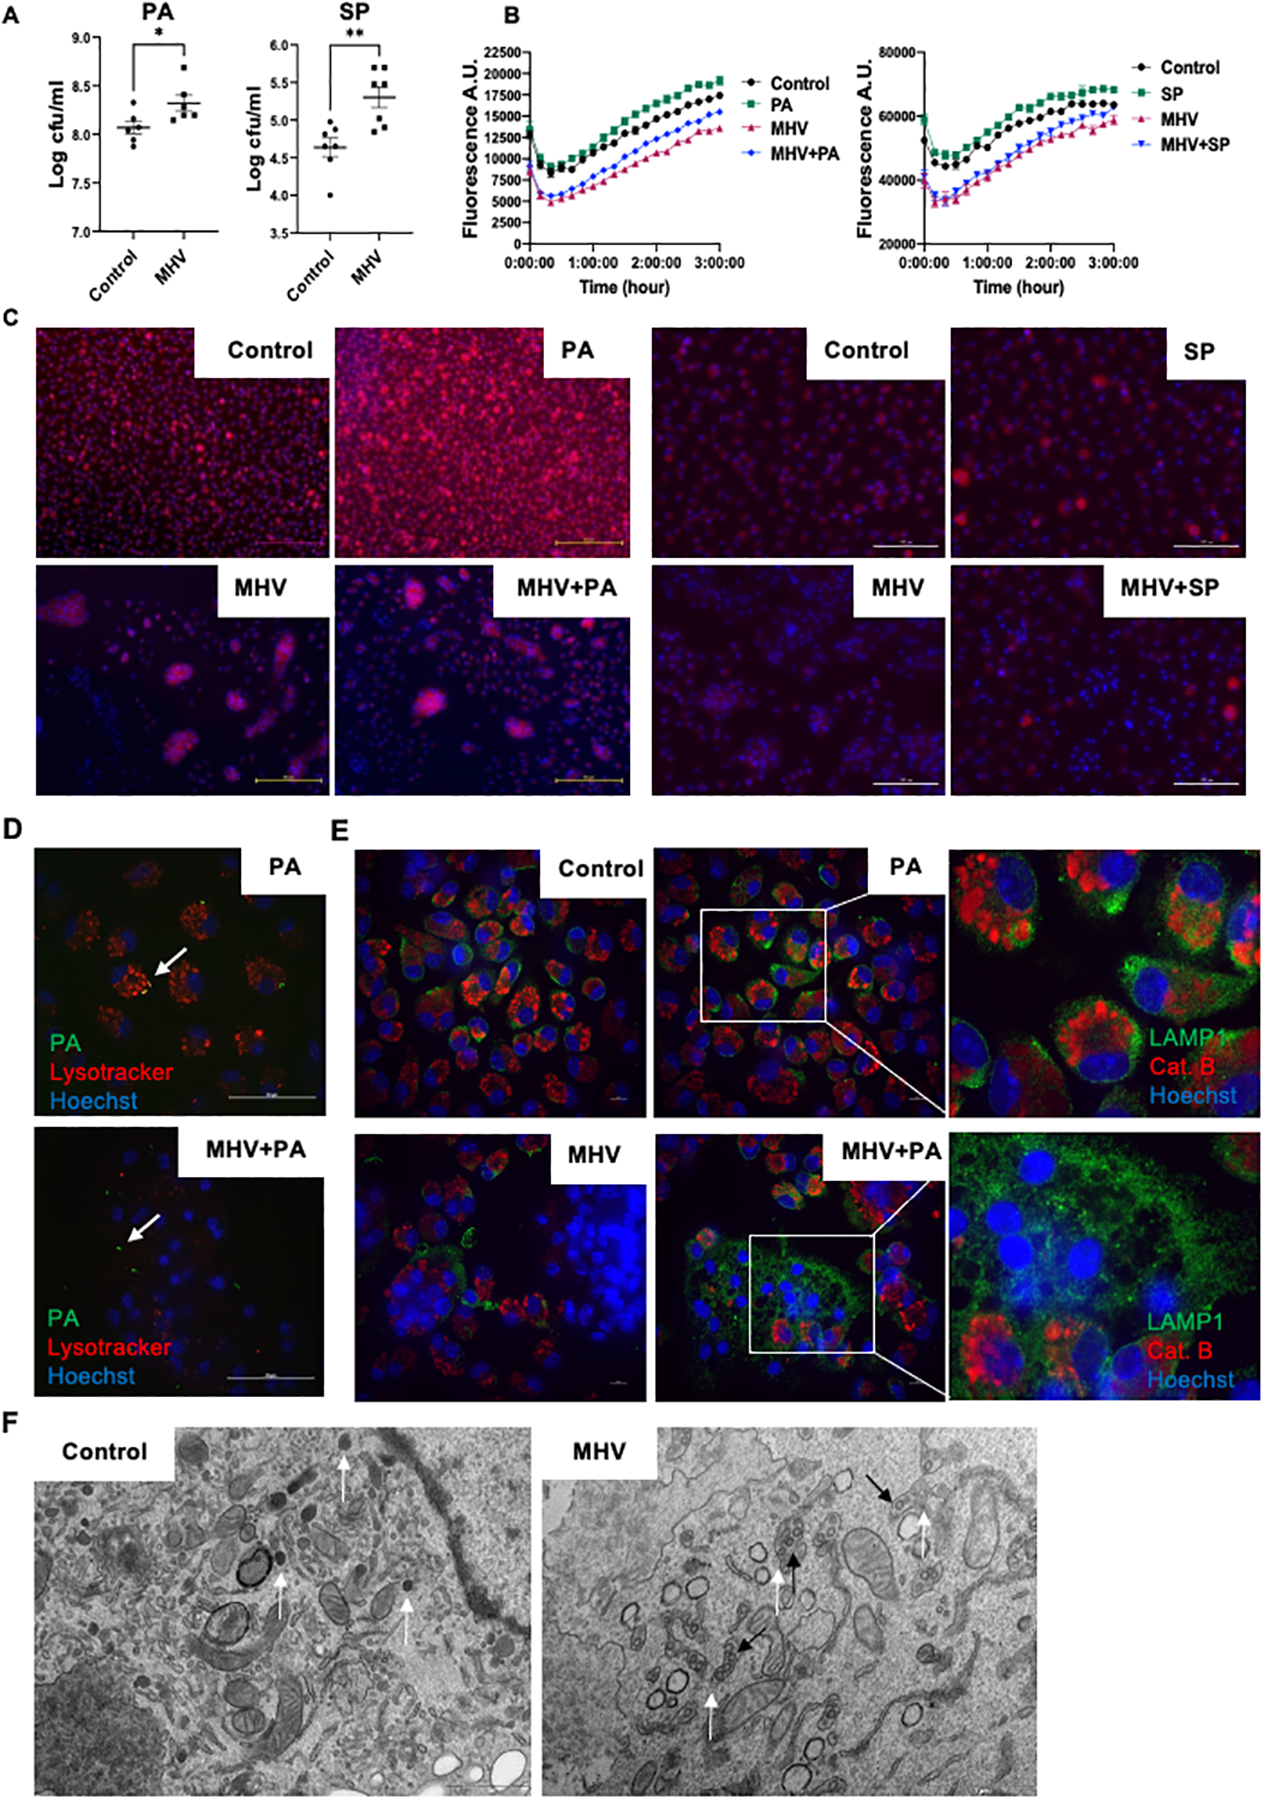
Fig. 3. MHV-induced lysosomal dysfunction impairs the bacterial killing ability of macrophages.

(A) Peritoneal macrophages were infected with MHV for 24 hours and then superinfected with a bacterial pathogen for 6 hours. Surviving bacteria were enumerated. (B) Lysosomal acidification of different groups of cells was measured using lysotracker for 3 hours post PA or SP infection. Cells were infected with MHV or vehicle for 20 hours before PA or SP infection according to different groups. (C) Representative images of acidified lysosomes detected by lysotracker after treatment of peritoneal macrophages with PA/SP, MHV, MHV+PA/SP or vehicle; red = lysotracker and blue = nucleus (Hoechst) at 2 hours. (D) Confocal microscopic analysis of phagocytosis and acidified lysosomal fusion in the presence or absence of MHV in the peritoneal macrophages. PA-GFP were (MOI of 20) used to infect the cells and lysosomes were stained using lysotracker (red). Blue = Hoechst. Pictures were taken at 2 hours post bacterial infection. Arrow points to fused acidified lysosomes and bacteria in the PA group while only bacteria in the MHV+PA group. Scale bar = 50 μm. (E) Confocal microscopic analysis of lysosomal enzyme release from peritoneal macrophages treated with PA, MHV, MHV+PA, or vehicle at 2 hours post bacterial infection. LAMP1 was stained in green as a lysosomal marker; cathepsin B was stained in red while blue indicates nucleus. (F) Transmission electron microscopic analysis of lysosomal structure in presence or absence of MHV infection at 20 hours post-MHV infection. Lysosomes are identified by their distinct morphology and dark color due to lysosomal enzymes. White arrows indicate normal lysosomal structures in the control cells and swollen lysosomes like vesicles in MHV infected cells. Black arrows indicate coronavirus in these vesicles. A.U. = arbitrary unit, Scale bar = 10 μm. *, P <0.05, **, P < 0.01 using t-test.
