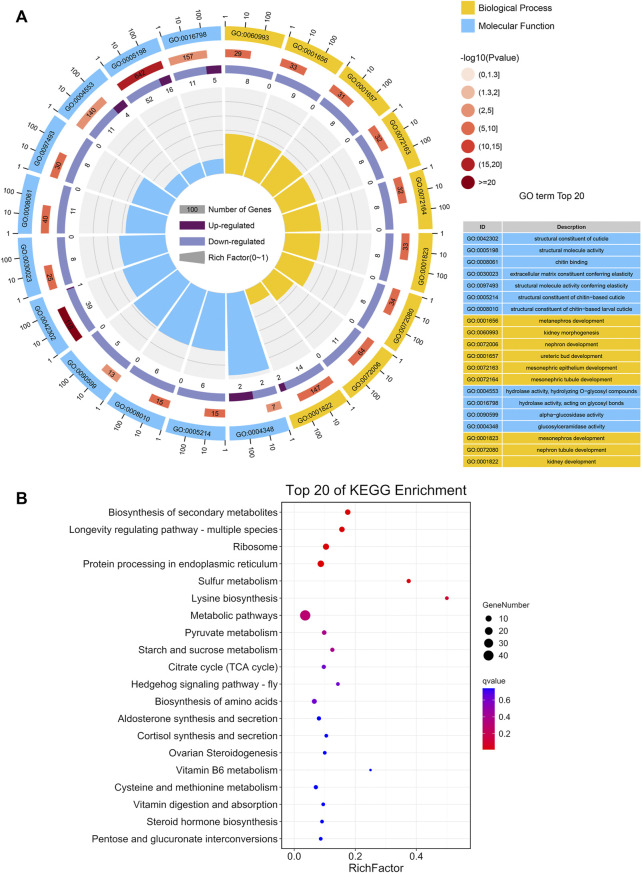
FIGURE 3.
Functional CLassification of DEGs between BPH reared on RH and TN1 varieties. (A) GO enrichment analysis of the DEGs. The outer ring represents the number of the top 20 enriched GO terms, and different colors indicate different ontologies. Ring 2 represents the gene counts in the whole genome background, and the color changes according to the Q-value of the enrichment analysis. Ring 3 represents the counts for upregulated and downregulated genes in corresponding GO terms. Ring 4 indicates the rich factor (the number of DEGs divided by the number of background genes in the corresponding term). (B) The DEGs in the Kyoto Encyclopedia of Genes and Genomes metabolic pathways.

