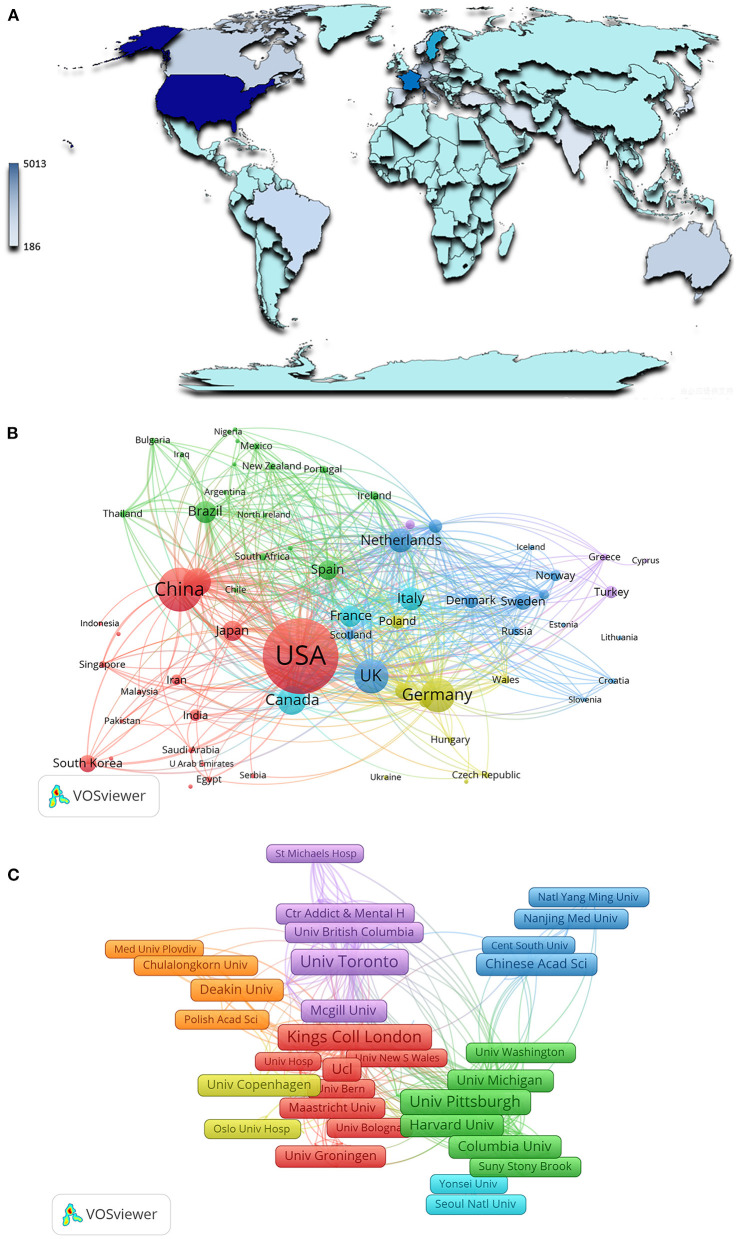
Figure 2.
Main countries/regions and institutions of depression biomarker research and their interrelationships. (A) Countries/Regions distribution of depression biomarker research results; (B) A visualization network of collaboration between countries/regions in depression biomarker research; (C) A visualization network of collaboration among institutions in depression biomarker research. The nodes in the map denote elements such as a country or institute, and link lines between nodes denote collaborative relationships. The larger the circle/frame, the more articles are published. The wider the line, the stronger the relationship.

