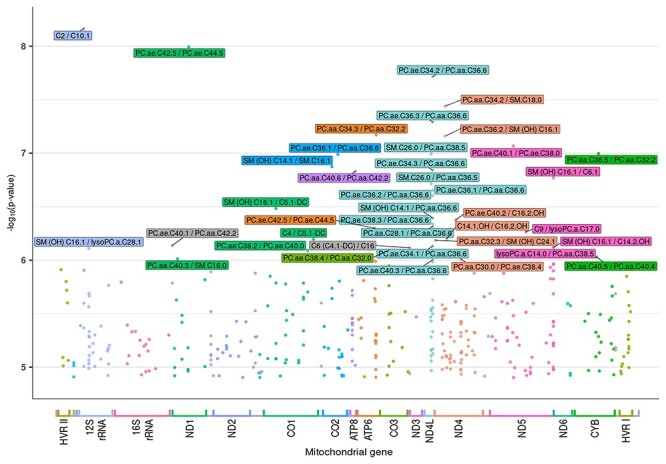
Figure 2.

Mitochondrial genome-wide P-values for metabolite ratios. Legend: On the y axis, P-values transformed into the negative of the base 10 logarithm, −log10(P-value), are shown. The x-axis represents the mitochondrial genome, displaying the position and relative size of each of the 13 major mitochondrial genes, 12S and 16S rRNAs, hypervariable region 1 (HVR I), hypervariable region 2 (HVR II) as well as the position of the 22 tRNAs (gray color).
