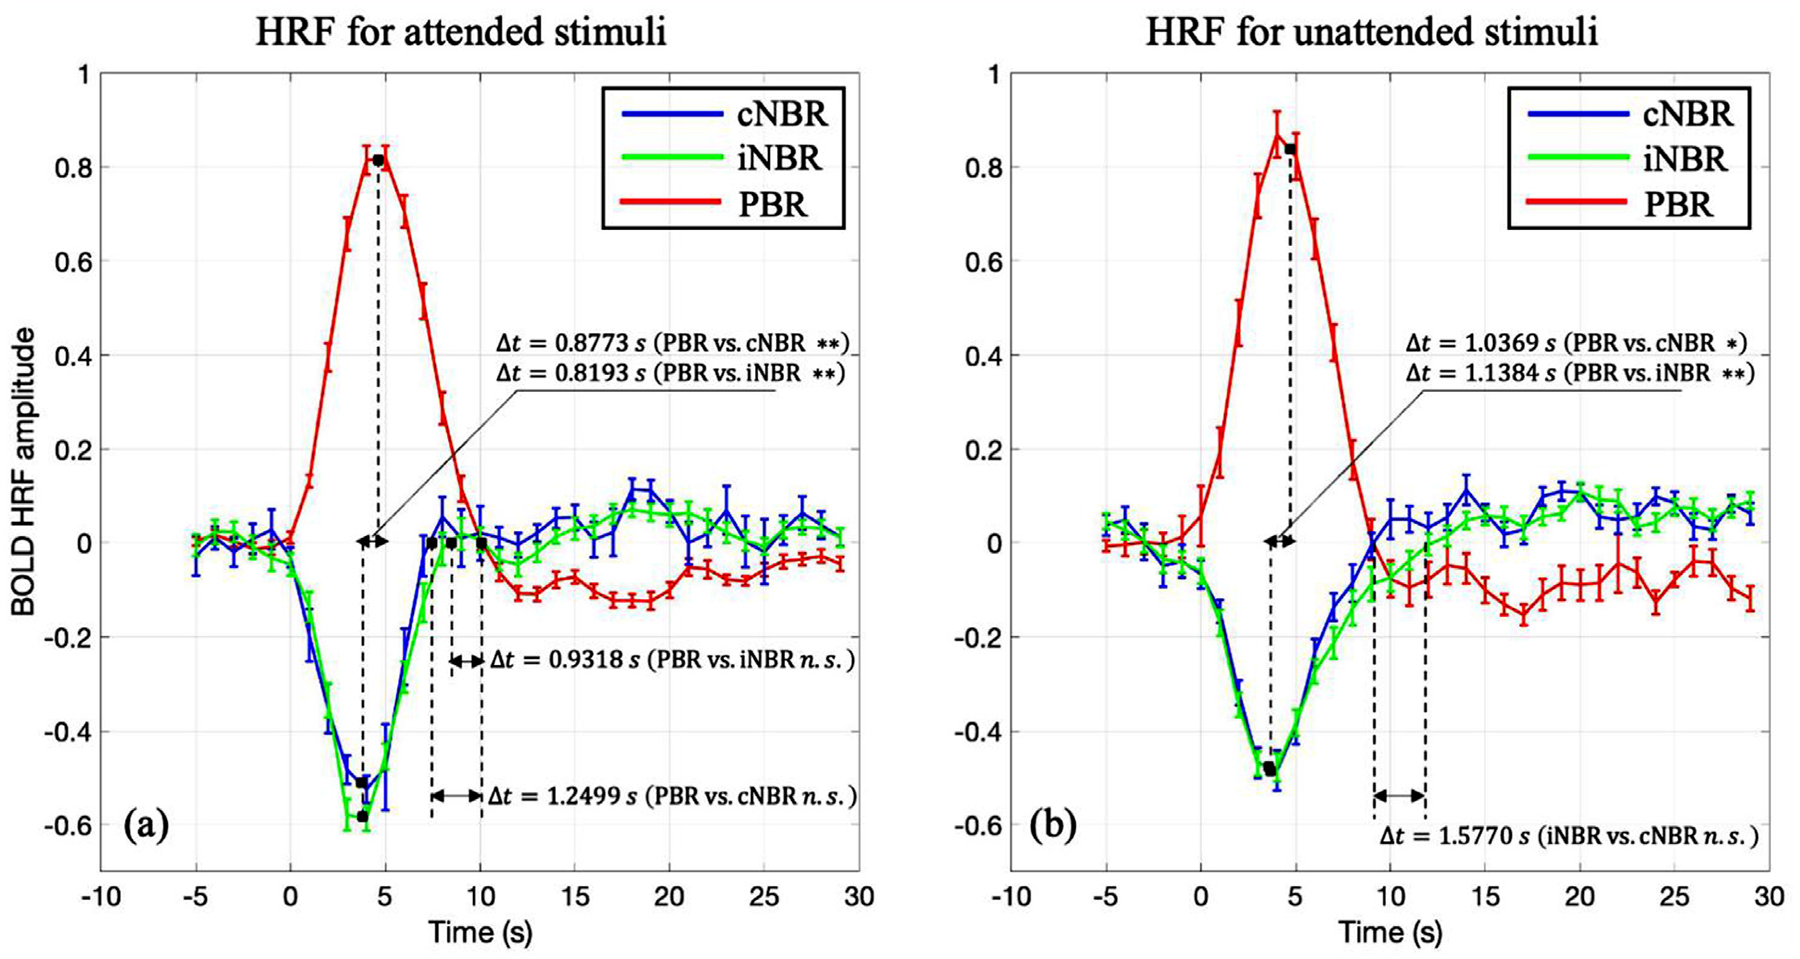
Fig. 5.

The HRFs of the positive BOLD, and contralateral/ipsilateral negative BOLD responses to (a) attended and (b) unattended visual stimuli. The curves are adjusted based on average of the HRF for 5 s prior to the stimulus onset. The unit of the magnitudes are percent changes (subtracted by mean and then divided by mean). Error bars represent the standard error of the mean. As is evident here, the two negative HRFs are closely similar in terms of their overall dynamics and amplitudes (* p < 0.05; ** p < 0.01; Bonferroni correction).
