
Fig. 7.
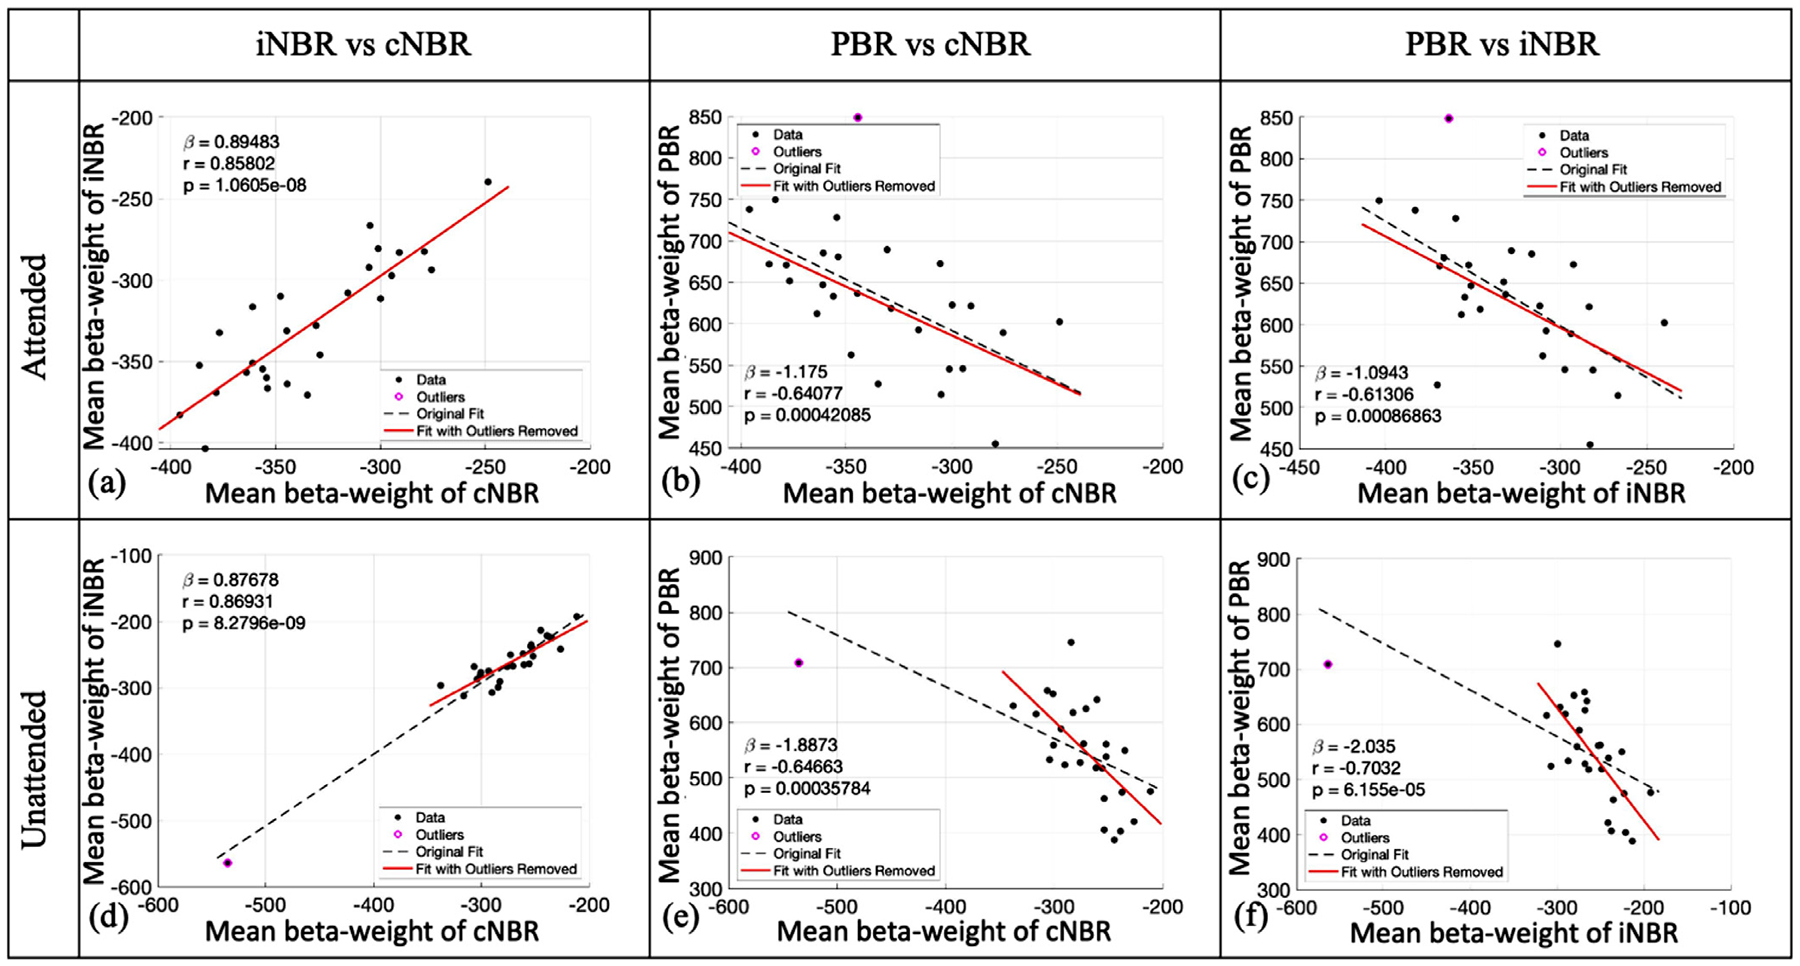
Correlation of the mean amplitudes of the BOLD responses to the visual stimuli in the attended (a–c) and unattended (d–f) conditions. The value of the slop, Pearson correlation coefficient, and the p-value of PCC are presented for each case. The dashed black lines represent the regression lines with all the data, and the solid red lines represent the regression lines with data after outliers were removed. As is depicted, regardless of the attention condition, the subject-wise expression of the iNBR and cNBR are significantly more correlated with each other than each one with the PBR.