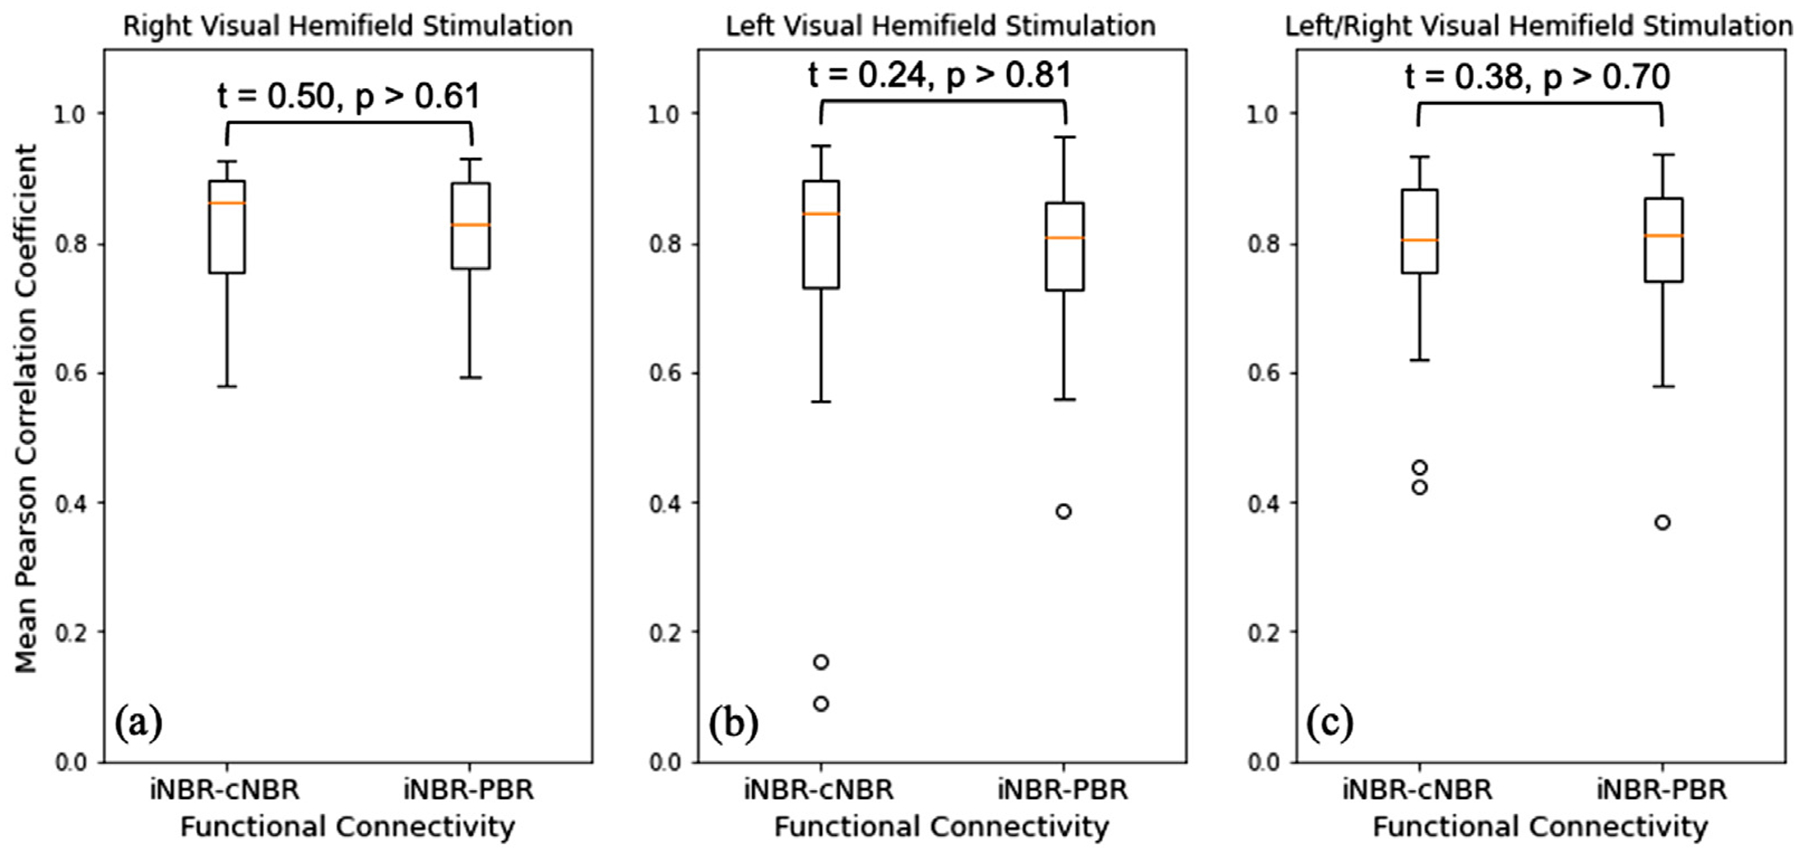
Fig. 8.

Subject-wise interhemispheric functional connectivity results between regions with iNBR and cNBR are depicted using Pearson correlation coefficient and a boxplot, alongside the subject-wise functional connectivity between regions with iNBR and PBR for (a) right visual hemifield stimulation, (b) left visual hemifield stimulation, and (c) the mean of the two functional connectivity measures. The results of the group differences are also presented in each plot using Student t-test.
