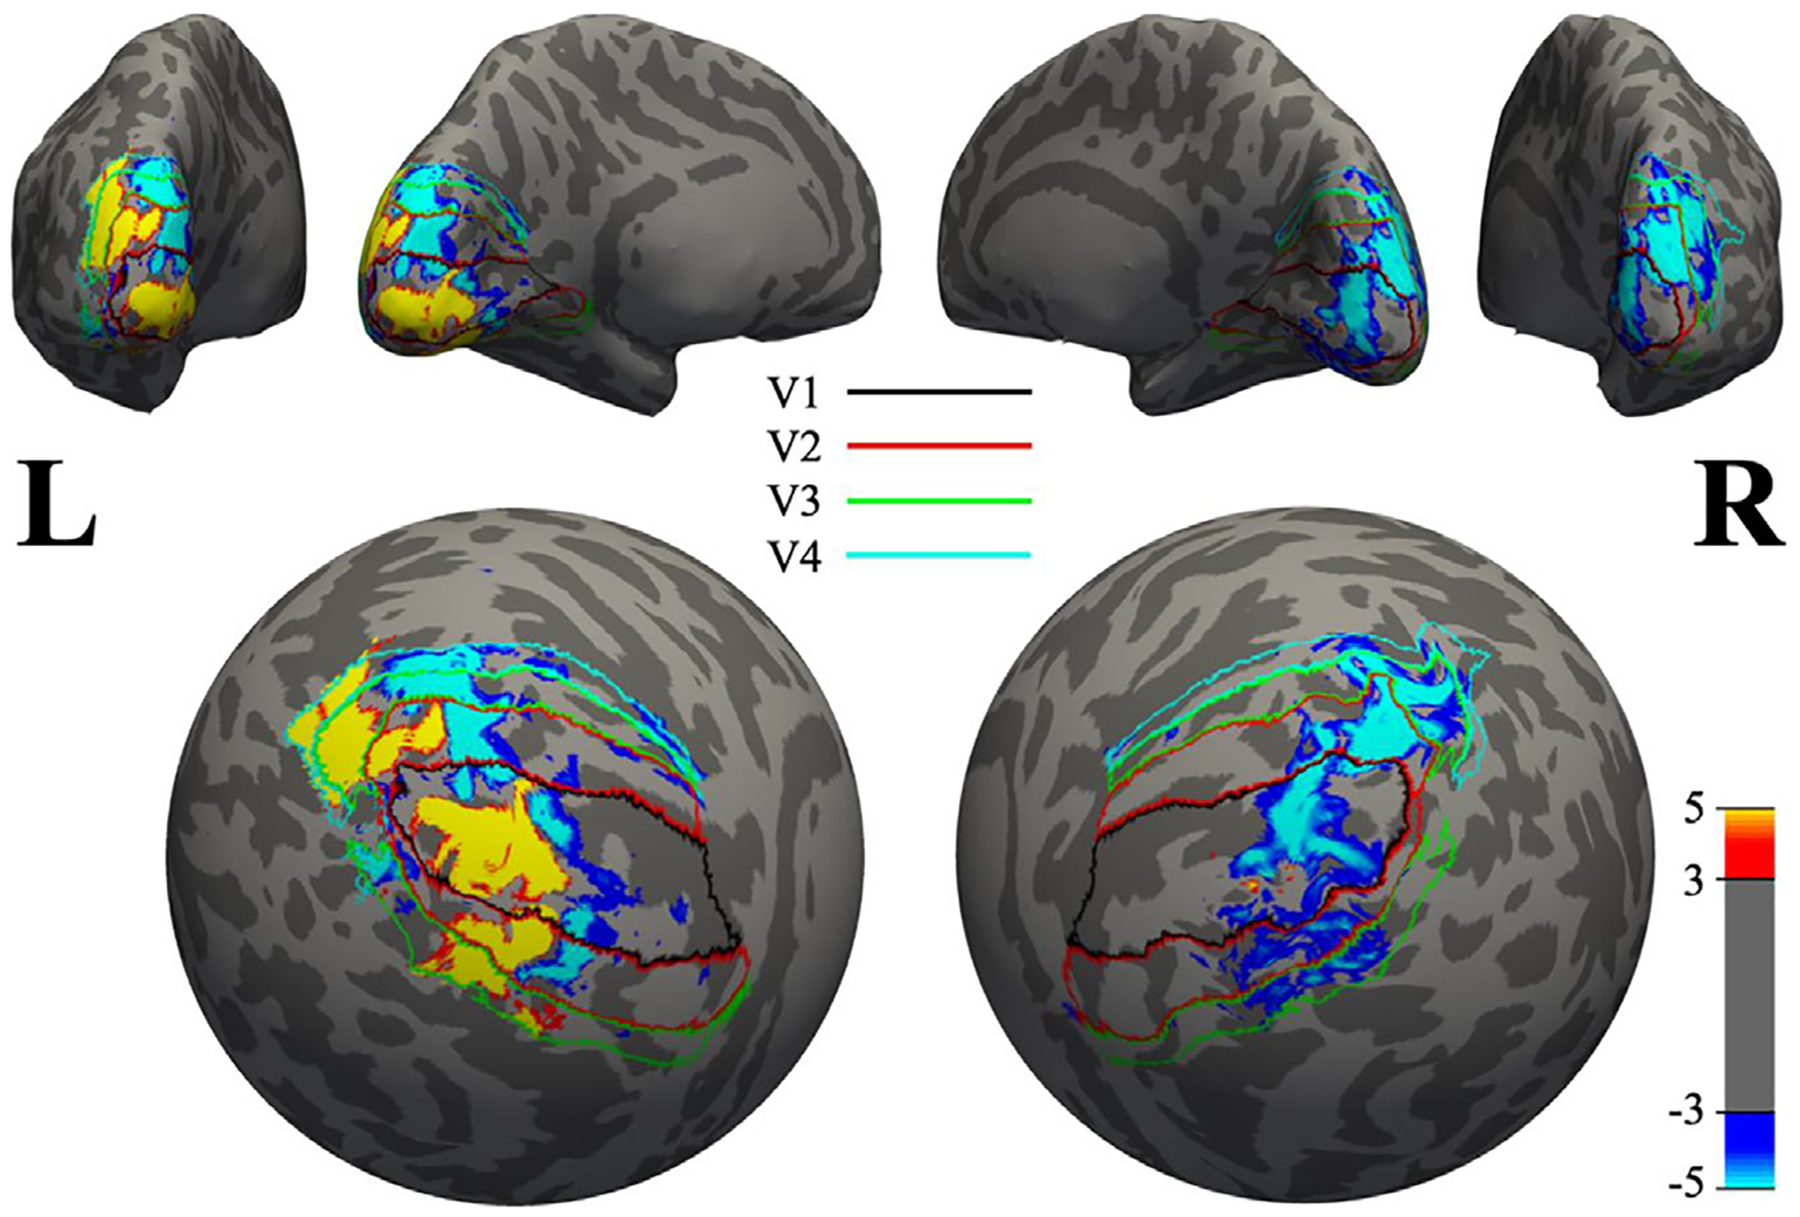
Fig. 9.

Spatial distribution of the PBR, cNBR, and iNBR overlaid on a sphere (inflated brain). Boundaries of different visual areas V1 to V4 are depicted using different colors. As is demonstrated here, the iNBR has a higher spatial correspondence to the PBR than to cNBR. Note that spatial smoothing is carried out only for improved visualization.
