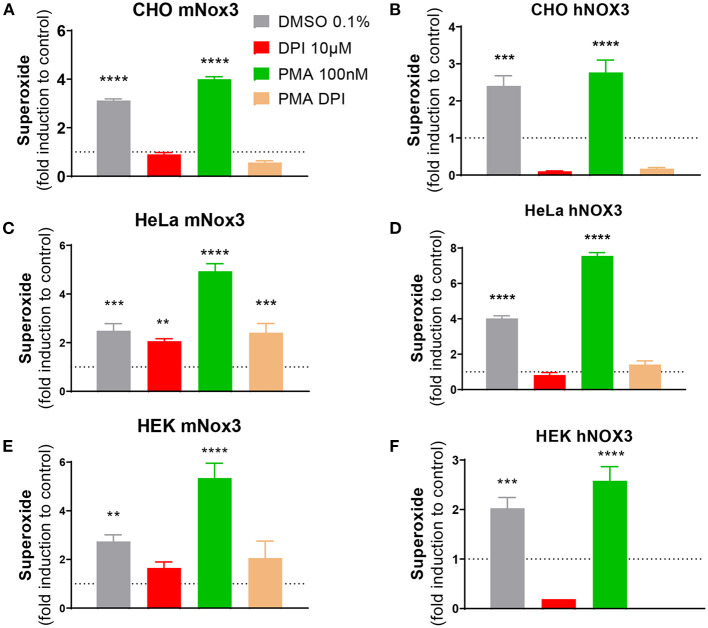
Figure 1.
Characterization of NOX3 activity in three cell lines expressing the mouse or human NOX3 complex. ROS production was evaluated in (A,B) CHO, (C,D) HeLa and (E,F) HEK293 transduced with all subunits of (A,C,E) mouse (mNox3) or (B,D,F) human NOX3 complex (hNOX3) by using a colorimetric WST-1 assay, detecting superoxide. Bar graphs represent NADPH activity of NOX3 in cells treated with DMSO, the NOX3 agonist PMA and/or the NOX inhibitor DPI. Data from every experimental condition was compared and normalized to the untransduced control (WT) for each cell type. DMSO, dimethyl sulfoxide; PMA, phorbol 12-myristate 13-acetate; DPI, diphenyliodonium. Data represent the average of three independent experiment +- SEM.

