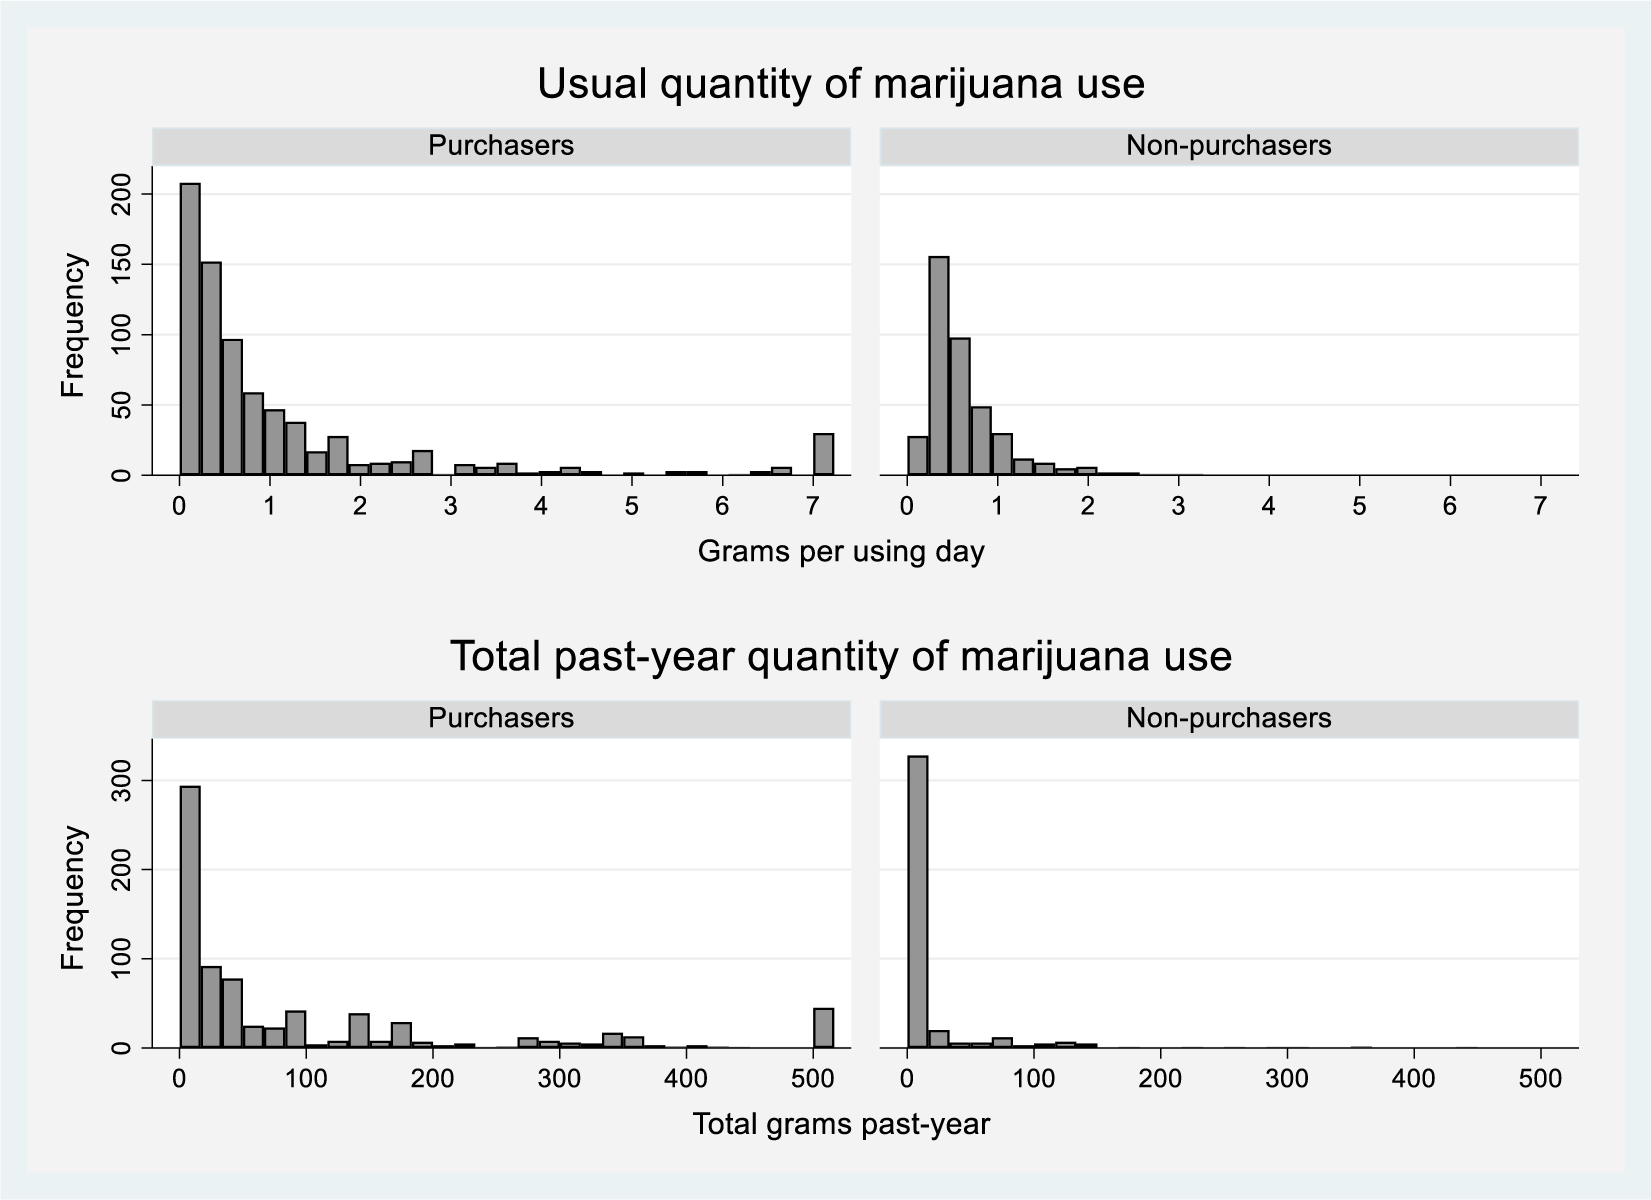
Figure 1.

Distributions of adjusted usual and total quantity of marijuana use for marijuana purchasers (n=777) and predicted usual and total quantity for non-purchasing users (n=400)1
1 Capped at 7 grams for usual quantity (involving 26 purchasers with usual quantity larger than 7 grams) and at 500 grams for total past-year quantity (involving 45 purchasers with total PY quantity larger than 500 grams)
