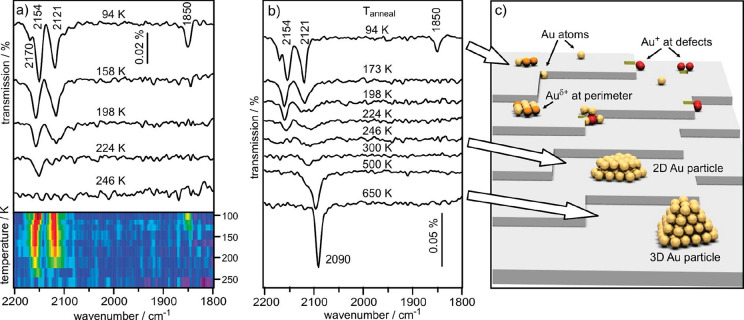
Figure 22.
(a) IR spectra of CO adsorbed on 0.02 ML Au/13 ML MgO(001)/Ag(001) as a function of temperature. Spectra were collected at the indicated temperature. Lower panel presents the results as an image plot with red being intense and blue representing no absorption. (b) IR spectra of CO adsorbed on 0.02 ML Au/13 ML MgO(001)/Ag(001) as a function of annealing temperature. Spectra were collected after recooling to 90 K and dosing with CO. (c) Model of the Au/MgO(001) surface representing the nature of Au species formed at various annealing temperatures as deduced from the IR spectra shown in part b. Reprinted with permission from ref (179). Copyright 2011 American Chemical Society.

