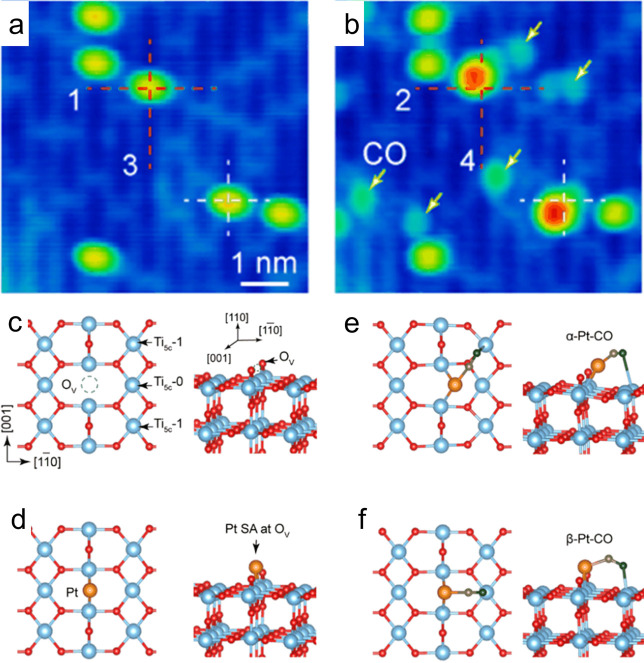
Figure 3.
STM images at 80 K showing 0.01 ML Pt adsorbed on the r-TiO2(110) surface before (a) and after (b) exposure to CO. Red and white crosses in a show the position of VO on the surface prior to Pt deposition. (b) Pt-related protrusions become larger (red) due to the adsorption of CO and move away from the vacancy site. This suggests the CO tilts toward the neighboring Ti row. Yellow arrows in b highlight CO adsorbed on the Ti rows. DFT models of the clean surface (c), Pt (orange) adsorbed in the VO site (d), and two variants of the Pt–CO species that were calculated (e, f). CO carbon and oxygen atoms are drawn in gray and black, respectively. Reprinted with permission from ref (60). Copyright 2017 AIP Publishing.

