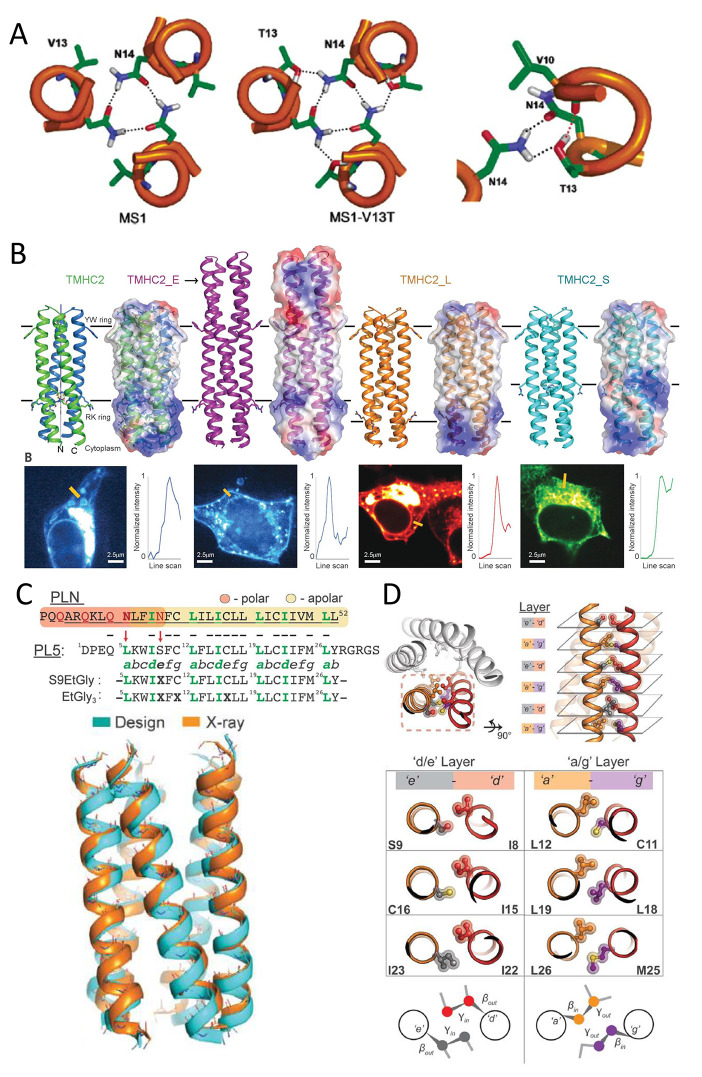
Figure 15.
(A) Model of the trimeric structure of MS1 and MS1-V13T. Side chains from residues 13 and 14 are shown. Hydrogen bonds are represented as dashed lines. The polar network is shown in detail on the right. Interhelical hydrogen bonds are shown as black dashes, and the intrahelical hydrogen bond is shown in red. Reprinted with permission from ref (364). Copyright 2006 American Chemical Society. (B) Design models with IC and EC regions of four transmembrane proteins (top). From left to right, TMHC2 (transmembrane hairpin C2), TMHC2_E (elongated, PDB ID: 6B87), TMHC2_L (long span), and TMHC2_S (short span). Horizontal lines demarcate the membrane regions. Ribbon diagrams are at left, electrostatic surfaces are at right. Confocal microscopy images for HEK293T cells transfected with fluorescent tag fused TMHC2 proteins are at bottom. Line scans show fluorescence change across the membrane. Reprinted with permission from ref (173). Copyright 2018 The American Association for the Advancement of Science. (C) Sequence alignment of phospholamban and PL5. Phospholamban’s polar region (orange) and nonpolar region (yellow) highlighted; transmembrane helix underlined. The heptad repeat is labeled abcdefg; LxxIxxx motif, green. Red arrows indicate polar-to-nonpolar mutations. Superimposition shows a close match between the PL5 crystal structure (PDB ID: 6MQU, orange) and the MD-refined design model (Cyan). (D) Side chain steric packing at PL5′s helical interface. The repeated symmetrical interaction of helices provides the primary stabilization for PL5. Geometric complementary residues interact across the interface, roughly in layers characterized by two categories: a/g and e/g layers. Cα–Cβ and Cβ–Cϒ bond vectors point at opposite directions within the two layers. C, D: Reprinted with permission from ref (372). Copyright 2018 The American Association for the Advancement of Science.

