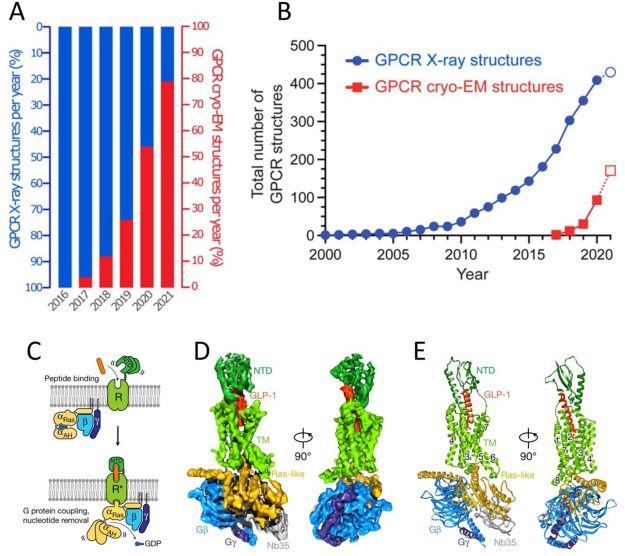
Figure 39.
(A) Percentage of GPCR structures in the PDB determined by Cryo-EM per year. (B) Cumulative numbers of GPCR structures determined by X-ray crystallography and Cryo-EM, which include multiple structures of the same receptor bound to different ligands, intracellular binding partners, or non-native species. The data for 2021 includes only the first seven months of the year. A, B: Reprinted with permission from ref (841) under Creative Commons licenses. (C) Schematic of the activation of a class B GPCR by extracellular peptide agonist via a “two-domain” binding mechanism. (D) Cryo-EM density map of the GLP-1R:Gs complex, colored by subunits (transmembrane domains in light green, NTD in dark green, GLP1 peptide in orange, Gαs Ras-like in gold, Gβ in light blue, Gγ in dark blue, and Nb35 in gray). GLP-1R (PDB ID: 5EE7). (E) Structure of the activated GLP-1R:Gs complex in the same view and color scheme as shown in D. C–E: Reprinted with permission from ref (842). Copyright 2017 Springer Nature.

