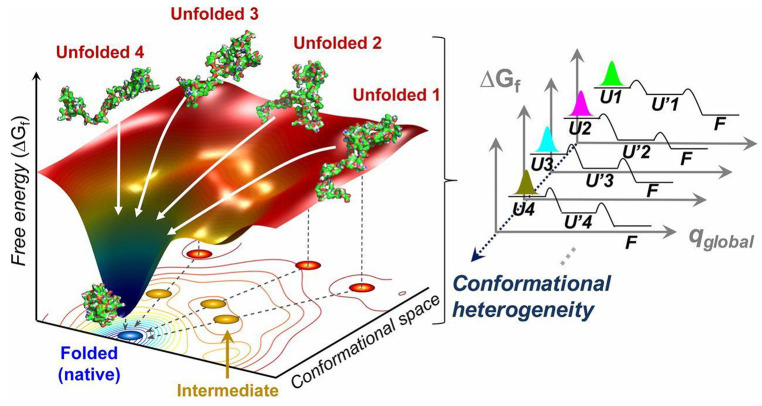
Figure 6.
Schematic of the folding dynamics in a funnel-like free energy landscape. Red dots represent unfolded states; yellow dots represent intermediates states visited with local energy minima; blue dot represents final native conformation residing in global minimum. Multiple parallel pathways (white arrows) might present in spontaneous folding. The number of representative unfolded conformations is related to the trajectory. The observed stretched exponential folding kinetics is the result of the superposition of the multiple pathways from the unfolded substates (Ui, i = 1 to N) to the folded state (F) via intermediate substates (U’i, i = 1 to N), indicating conformational heterogeneity. Reprinted with permission from ref (190). Copyright 2013 Elsevier.

