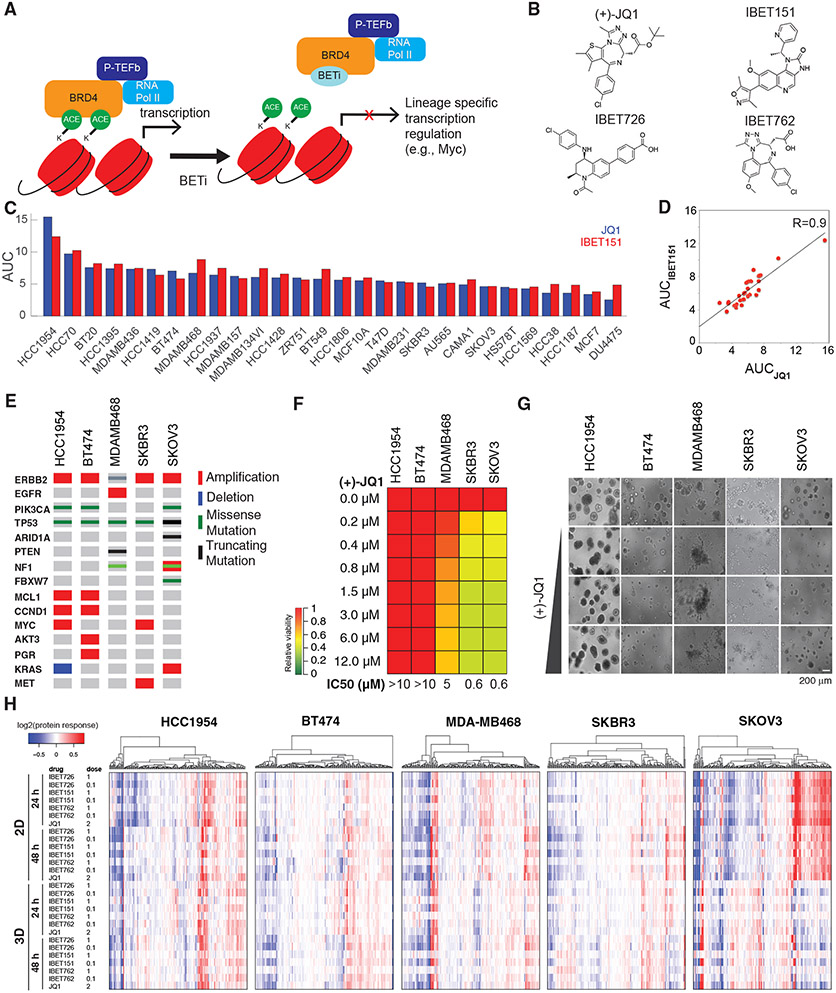
Figure 1. Breast cancer cells have differential responses to BET inhibition.
(A) BETi binds to the acetyl histone binding cavity on BET proteins, prevents recruitment of BET to chromatin, and alters expression of lineage-specific genes.
(B) Chemical structures of the BETis used in the perturbation experiments.
(C) The relative responses to the BETis JQ1 and IBET151 across 27 breast cancer lines and the ovarian cancer line SKOV3 are quantified as AUC of the dose-response relationship (dose range 0–10 μM).
(D) Scatterplot of responses to IBET151 versus JQ1 across the cell lines in (C) demonstrates the similarity in phenotypic response to the two BETis.
(E) Landscape of potential driver oncogenic events in selected cell lines.
(F) Dose-dependent responses to JQ1 in cell lines cultured in 3D matrigel.
(G) Images of dose-dependent responses to JQ1 in 3D Matrigel-cultured cells.
(H) Proteomic response map of the cell lines to BET inhibition. Proteomic data was collected with RPPA using antibodies that quantify 217 total or phosphoprotein levels (two time points, 2D and 3D cultures, varying doses of the four BETis in B, mean of duplicates).

