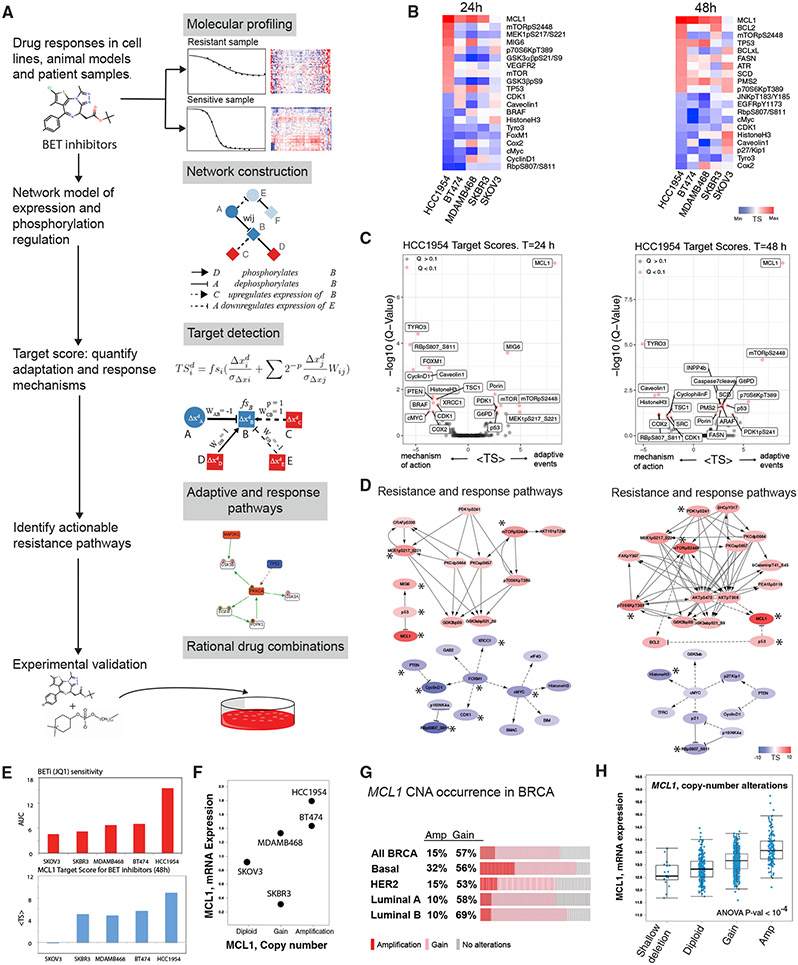
Figure 2. Computational network modeling identifies MCL1 upregulation as an adaptive response to BET inhibition.
(A) The TargetScore algorithm (see STAR Methods) identifies network-level adaptive responses to targeted perturbations based on molecular drug response data. The method involves (1) molecular profiling of responses to perturbations in samples with varying sensitivity to the perturbation agent. (2) Construction of a reference network that captures potential relations between all measured proteomic entities. (3) Quantification of a sample-specific adaptation (target) score that links protein interactions to drug response on the reference network using proteomic data. (4) Identification of network modules that have a significantly high TargetScore (i.e., collectively participate in adaptive responses) in each sample. (5) Selection of actionable targets that participate in adaptive responses and experimental testing of drug combinations.
(B) Heatmaps capture the highest and lowest 10 TargetScores for 24 (left) and 48 (right) h post-treatment in 3D cultures. The ranking in the HCC1954 is used as reference, and cell lines are ordered from most resistant (HCC1954) to most sensitive (SKOV3).
(C) Analysis and statistical assessment of adaptive responses (positive TargetScore) and direct responses (negative TargetScore) in HCC1954 24 (left) and 48 h (right) post-treatment. TargetScores are based on the average values across the four BETis in Figure 1B. The Q values represent the FDR-adjusted p values against the TargetScore-null distribution.
(D) Network modules of adaptive responses and mechanisms of action 24 (left) and 48 h (right) post-treatment. Asterisk (*) denotes the significantly strong TargetScores according to the statistical validation (see STAR Methods).
(E) Association of MCL1 mean TargetScore across four BETis (top) and BETi sensitivity (bottom). The Spearman correlation between the predicted adaptive responses to BETi and resistance to BETi is 0.9 (p = 0.04).
(F) Copy-number and mRNA expression status of MCL1 in cell lines.
(G) The frequency of breast cancer samples with high- (red) and low- (pink) level copy-number increases in MCL1.
(H) Distribution of MCL1 mRNA levels with varying MCL1 copy-number statuses across breast cancer samples (TCGA).

