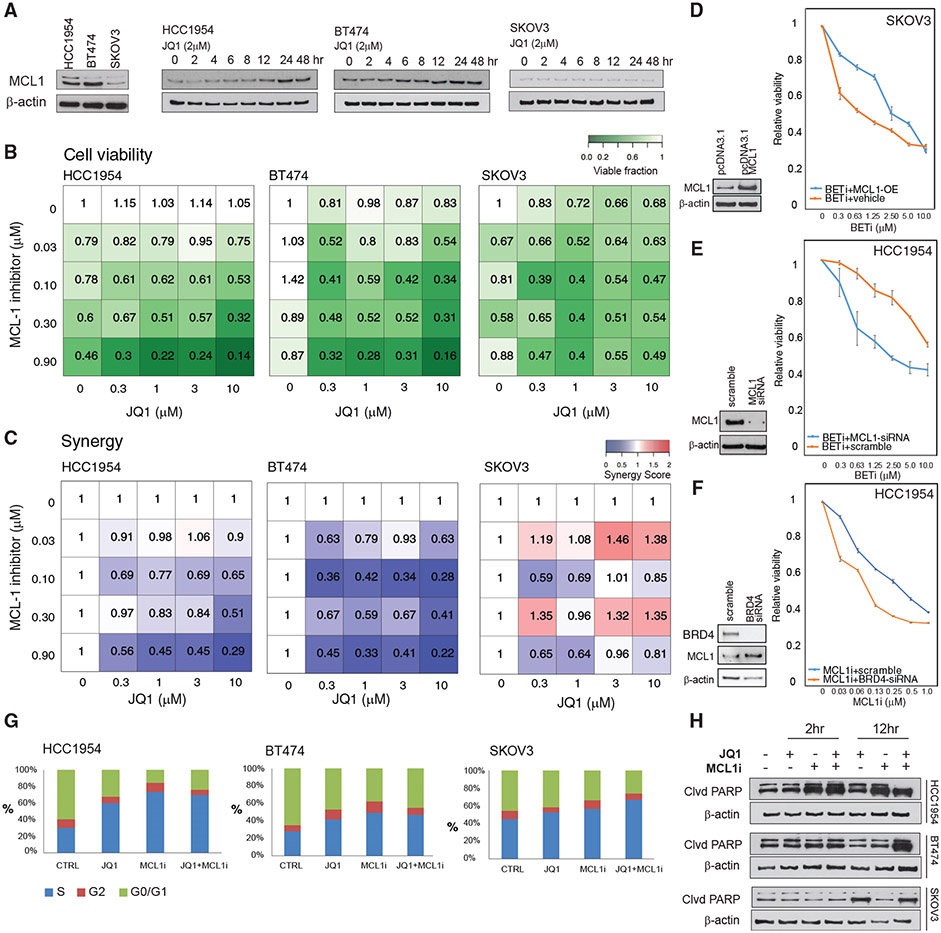
Figure 3. BET and MCL1 inhibitors are synergistic in breast cancer cells.
(A) MCL1 protein expression in drug-naive BETi-resistant (HCC1954, BT474) and BETi-sensitive (SKOV3) cells in 3D spherical cultures (left). MCL1 protein level changes in response to BET inhibition (2 μM of JQ1, 0 to 48 h).
(B) Cell viability response (mean of triplicates) to inhibitors of MCL1 (S63845) and BET (JQ1) in HCC1954, BT474, and SKOV3 cells in 3D spherical cultures supplemented with 2% Matrigel.
(C) Interactions between BETi and MCL1i are quantified using the Bliss independence method.
(D) Overexpression of MCL1 protein in SKOV3 cells confers resistance to BETi. The western blots comparing the MCL1 expression in cells transformed with empty versus MCL1-expressing pcDNA3.1 plasmid (left). The cell viability responses to BETi in wild-type versus MCL1-overexpressing SKOV3 cells (right).
(E) MCL1 knockdown (KD) with siRNA in HCC1954 cells leads to increased BETi sensitivity. The western blot confirms KD of MCL1 (left). The cell viability responses to JQ1 in HCC1954 with WT-MCL1 versus MCL1-KD (right).
(F) BRD4 KD with siRNA in HCC1954 sensitizes cells to MCL1 i. The western blots confirm KD of BRD4 and subsequent increase in MCL1 levels (left). The BRD4 KD and S63845 cell viability responses (right).
(G) The shifts in cell-cycle stage distribution in HCC1954, BT474, and SKOV3 in response to JQ1 (2 μM) and S63845 (0.3 μM) combination 48 h post-treatment are quantified using flow cytometry.
(H) Western blot analysis of cleaved PARP levels monitors apoptotic response to JQ1 and S63845 2 and 12 h post-treatment.
In (D)–(F), the error bars represent ±SEM over 4 replicates.

