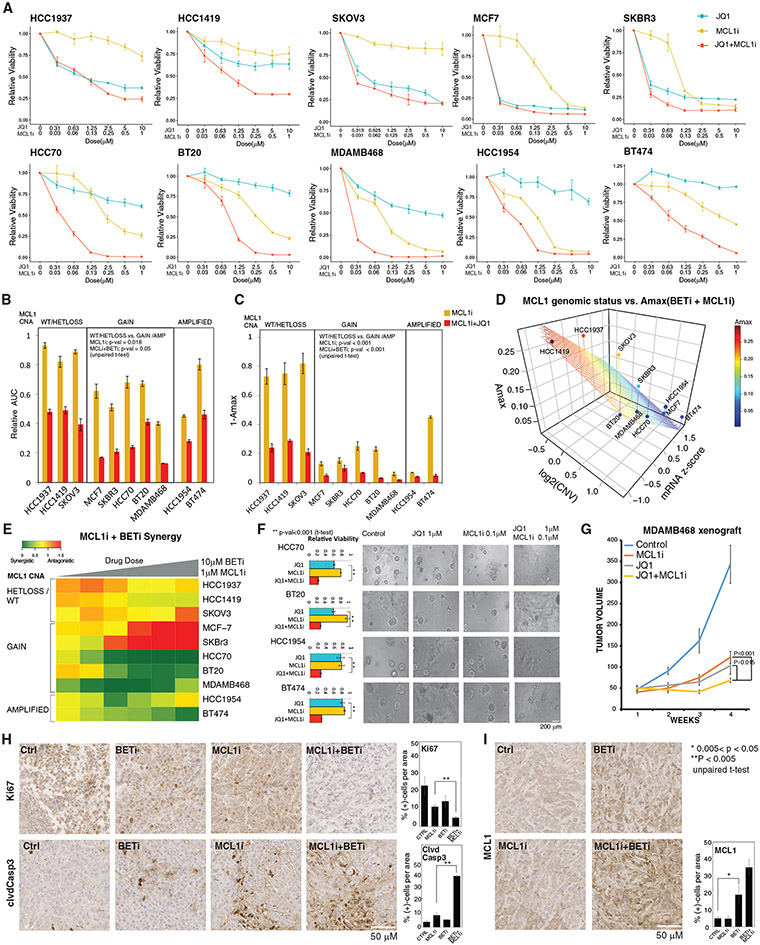
Figure 4. Molecular determinants of responses to MCL1 and BET inhibition.
(A) Dose-response curves of BETi (JQ1) and MCL1i (S63845) in breast and ovarian cancer cell lines (error bars represent ±SEM over triplicates).
(B) The normalized AUC (AUC/AUC100% viability) for S63845 and combination of JQ1 and S63845. Cell lines are classified based on the MCL1 copy-number status. The p values represent the significance of the response differences in cells with MCL1 copy-number WT/HETLOSS versus gain/amplification based on an unpaired t test. Error bars represent the ±SD over triplicates.
(C) Amax (response at maximum dose) for S63845(1 μM) and combination of JQ1 (10 μM) and S63845 (1 μM), classified according to MCL1 copy-number status. Error bars represent the ±SD over triplicates.
(D) The relation between combination therapy Amax, MCL1 mRNA levels, and copy-number status (source: CCLE). The surface represents the linear regression between Amax (dependent) and MCL1 copy-number and mRNA (independent) variables across cell lines.
(E) The synergy between JQ1 and S63845 is quantified with Bliss independence score for increasing doses of drugs for cell lines with varying MCL1 copy-number statuses.
(F) Cell viability responses to JQ1 (1 μM) and S63845 (0.1 μM) in 3D cultures of select cell lines. Images are collected 72 h after drug treatment. The p values are calculated with a t test over the triplicates between the combination and most effective single-agent arms. Error bars represent the ±SD over triplicates.
(G) Tumor volume curves in the MCL1-high MDAMB468 xenografts treated with BETi and MCL1i (each agent at 20 mg/kg, intraperitoneal injections 3 times/week). N = 9/arm for control, 8/arm for treatment cohort. The statistical differences were assessed with Mann-Whitney U test, and error bars represent the ±SEM of the responses in replicates.
(H) Representative images of IHC analysis for Ki67 and cleaved caspase 3 in xenografts 10 days after onset of drug treatments. The percentage of positive cells is quantified based on counts from 3 regions of interest (ROIs) of equal sizes in each condition. Error bars represent standard deviations over ROIs. Error bars represent the ±SD over triplicates.
(I) Representative images of IHC analysis for MCL1 response to BET and MCL1 inhibition 10 days after onset of in vivo drug treatments. The bar chart (right) quantifies the MCL1 positivity based on counts from 3 equal sized ROIs per condition. Error bars represent the ±SD over triplicates.
In (H) and (I), the statistical significance between groups of interest are demonstrated with a t test over the replicates, each representing an ROI on the corresponding IHC slide.

