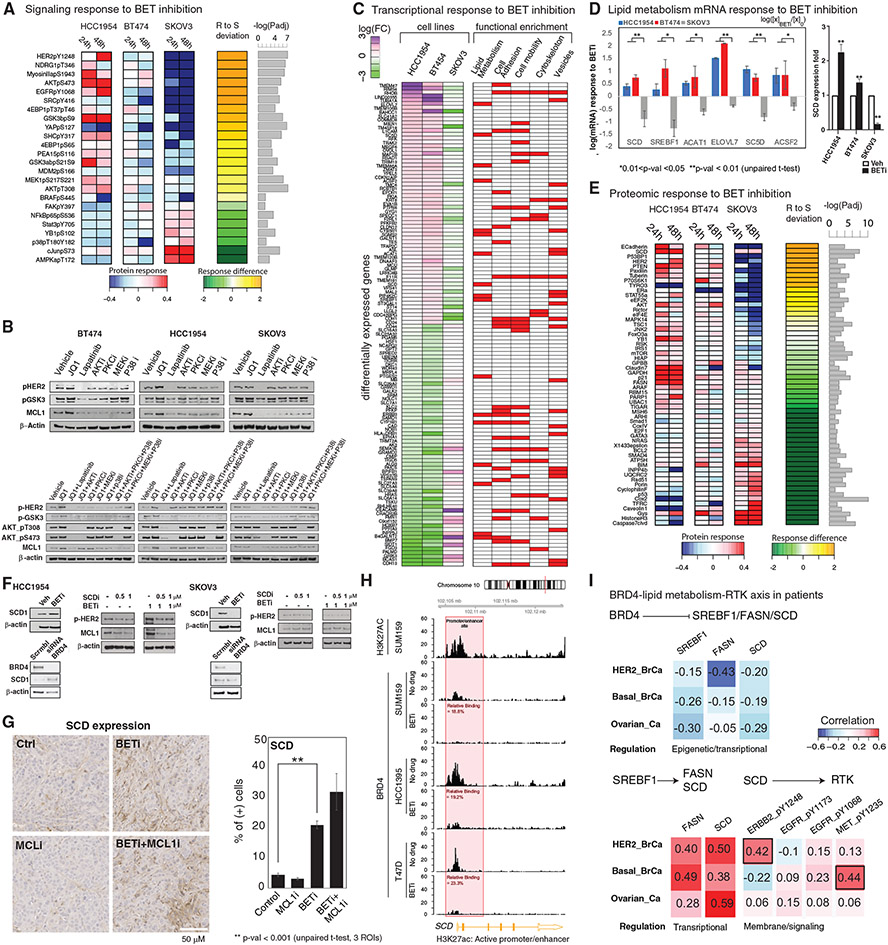
Figure 5. Molecular mechanisms of response to BET and MCL1 co-targeting.
(A) Differential analysis of phosphoproteomic responses to BETis in resistant (HCC1954, BT474) and sensitive (SKOV3) cells. The heatmap represents the average log fold difference (log[Xperturbed/Xunperturbed]) across the four BETis (Figure 1B). “R to S deviation” is the fold changes between responses in resistant (HCC1954 and BT474) and sensitive (SKOV3) cells. The proteins with significantly different expressions between HCC1954 (most resistant) and SKOV3 (sensitive line) are listed (padj < 0.05).
(B) MCL1 and signaling activity changes in response to cocktails of pathway and BET inhibitors are monitored to demonstrate the role of signaling pathways linking BET and MCL1 activity.
(C) Differential analysis of transcriptomic responses (mean of duplicates) to BETi (1 μM, 24 h). The first three columns demonstrate fold changes of mRNA species that change in opposite directions in resistant versus sensitive lines. The red/white columns on right represent the involvement of each gene in different molecular processes according to a GO-term enrichment analysis.
(D) Transcriptomic responses (mean of duplicates) in key genes of the lipid metabolism pathway as identified by the differential response analysis from the RNA sequencing (RNA-seq) data (left) and confirmed based on qPCR analyses for the key rate-limiting enzyme SCD. RNA-seq analysis: error bars represent the ±SEM. pPCR analysis: error bars represent the ±SD.
(E) The differential analysis focusing only on total protein changes performed as in (A). The heatmaps represent the proteomic responses averaged across four BETis.
(F) The analysis of SCD, MCL1, and p-EGFR/p-HER2 levels in response to inhibitors of BET (JQ1) and SCD (A939572), as well as BRD4 KDs with siRNA.
(G) Representative images of IHC analysis of in vivo SCD expression in the mouse xenograft model (MDA-MB468) treated with BET and MCL1 inhibitors. Error bars represent the ±SD.
(H) ChIP-seq analysis of BRD4 binding on SCD gene regulatory sites in breast cancer cell lines treated with BETis (JQ1) (see Figure S5 for FASN and SREBF1).
(I) Correlation analysis of proteomic and transcriptomic levels involved in the associations linking BET to EGFR/HER2 within tumors of patients with ERBB2-amplified, basal breast, and ovarian cancer. All correlations are in the range of −0.5 to 0.5. As a reference, the average correlation between mRNA and protein levels of a given gene is estimated within a range of 0.3–0.6 across the whole genome (Liu et al., 2016; Gry et al., 2009) (data from TCGA breast and ovarian cancer projects).

