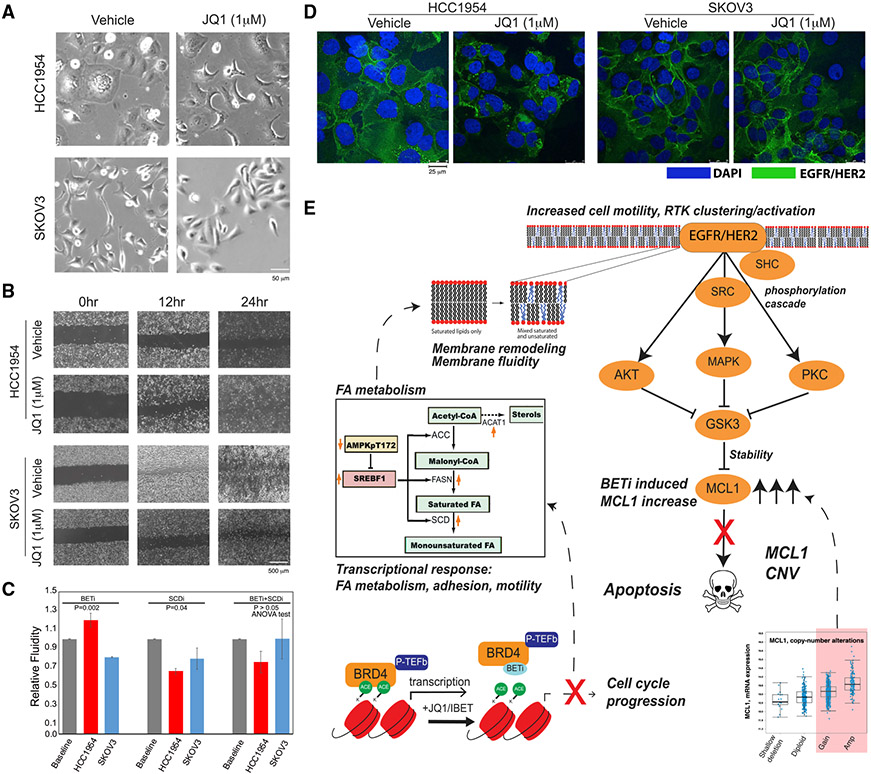
Figure 6. Phenotypic responses to BET inhibition in resistant cells.
(A) Representative images (20×, bright field) of cellular morphology changes in response to BETi (48 h, 1 μM JQ1).
(B) The BETi induces increased motility of HCC1954 (top) and no substantial difference in SKOV3 (bottom) as monitored across time points with a wound scratching assay.
(C) Drug-induced changes in membrane fluidity (mean of triplicates, error bars represent ±SEM) in HCC1954 and SKOV3 cells based on fluorescent lipophilic pyrene probes that are enriched in excimer state (emission = 470 nm) with increasing membrane fluidity and enriched in monomers (emission = 400 nm) with decreasing membrane fluidity.
(D) The representative images of HER2/EGFR localization changes in response to BET inhibition (48 h, 1 μM). Images are collected using fluorescent confocal microscopy (20×). The fluorescence signals from EGFR/HER2 (green) in BETi-treated HCC1954 cells suggest increased localization of the receptors. The EGFR/HER2 signal was unchanged in response to BETi in SKOV3.
(E) The proposed mechanism of BET inhibition-induced vulnerability to BET and MCL1 co-targeting in the context of MCL1 chromosomal amplifications or gains based on the integrated multi-omics, network, and perturbation analyses. The marked genes and proteins are identified and validated in molecular perturbation response analyses.

