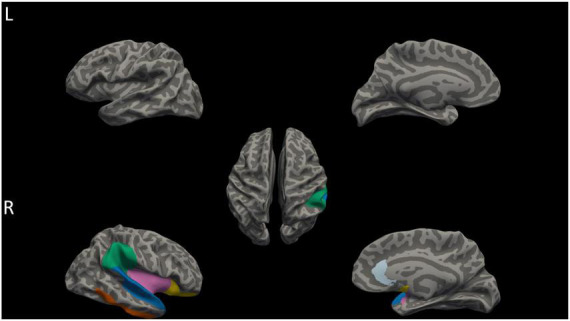
FIGURE 2.

Differences in cortical thickness among AVH, non-AVH, and HC groups. The right hemisphere of STG, ITG, SMG, lateral OFC, rACC, and INS (labeled in blue, orange, green, yellow, sky blue, and pink) showed significant differences in cortical thickness among three groups (p < 0.05, corrected for multiple comparisons with LSD). L, left; R, Right.
