FIGURE 3.

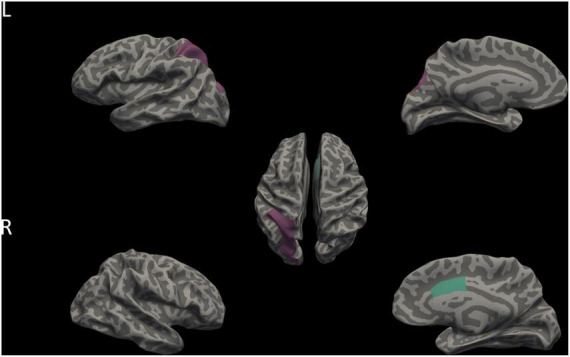
Differences in LGI among AVH, non-AVH, and HC groups. Purple and aqua green indicates two brain regions with significant differences in LGI among three groups (p < 0.05, corrected for multiple comparisons with LSD). L, left; R, Right.

Differences in LGI among AVH, non-AVH, and HC groups. Purple and aqua green indicates two brain regions with significant differences in LGI among three groups (p < 0.05, corrected for multiple comparisons with LSD). L, left; R, Right.