Figure 5.
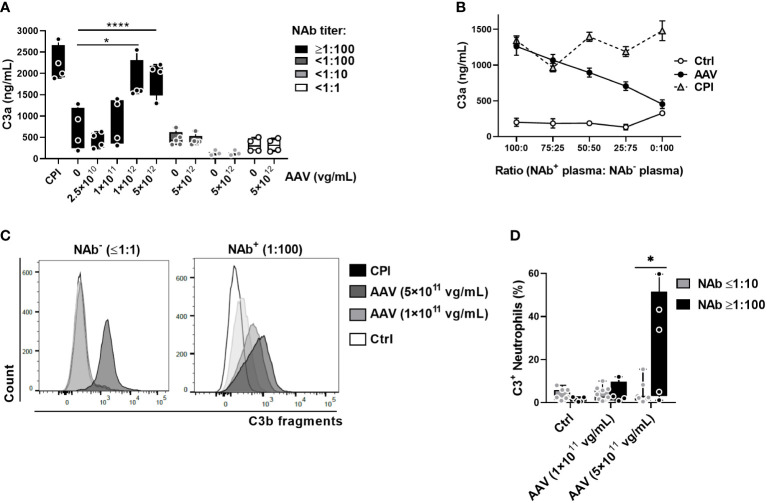
AAV NAbs enhance AAV-induced complement activation and C3 split products deposition on neutrophils. (A) C3a levels in human plasma with the indicated NAb titers, treated for 1 hour with various concentrations of AAV-Spark100. Significance was determined with a two-way ANOVA with Sidak’s multiple comparisons test, *p ≤ 0.05, ****p ≤ 0.0001. (B) NAb- (<1:1) and NAb+ (≥1:100) plasma was mixed at the indicated ratios and stimulated with 5×10¹¹ vg/mL of AAV-Spark100. Mean C3a levels ± SEM are shown (n=8). (C) Representative FACS plots and (D) graph of C3 fragment deposition on CD11b+ cells in the blood at 90 minutes after treatment with the indicated concentrations of AAV-Spark100. Bars represent the mean ± SEM and symbols represent the values of individual donors. Significance determined using the Holm-Sidak method *p ≤ 0.05.

