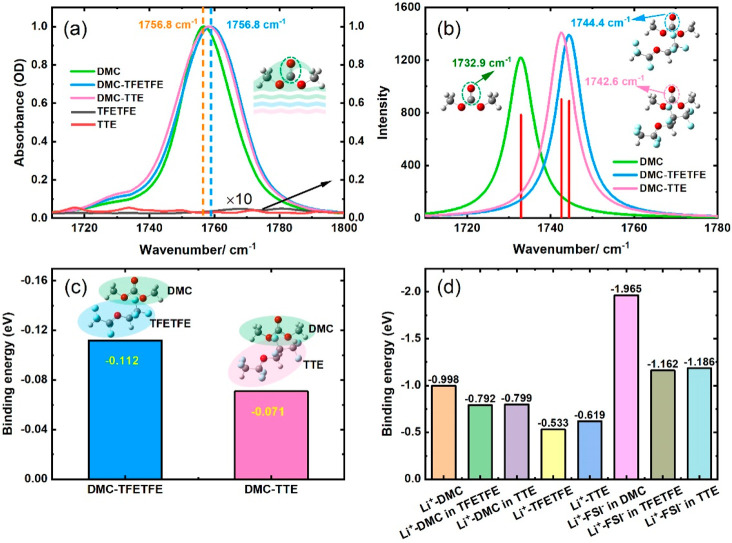
Figure 2.
FTIR spectra of pure DMC, a DMC–antisolvent mixture, and antisolvents. (a) Experimental data and (b) DFT calculated FTIR spectra; the insets show the optimized geometric configurations. (c) The binding energy of DMC–antisolvent complexes; the colored structures represent the modes of interaction between DMC and antisolvents. (d) The binding energies between Li+ and various species are calculated by DFT.

