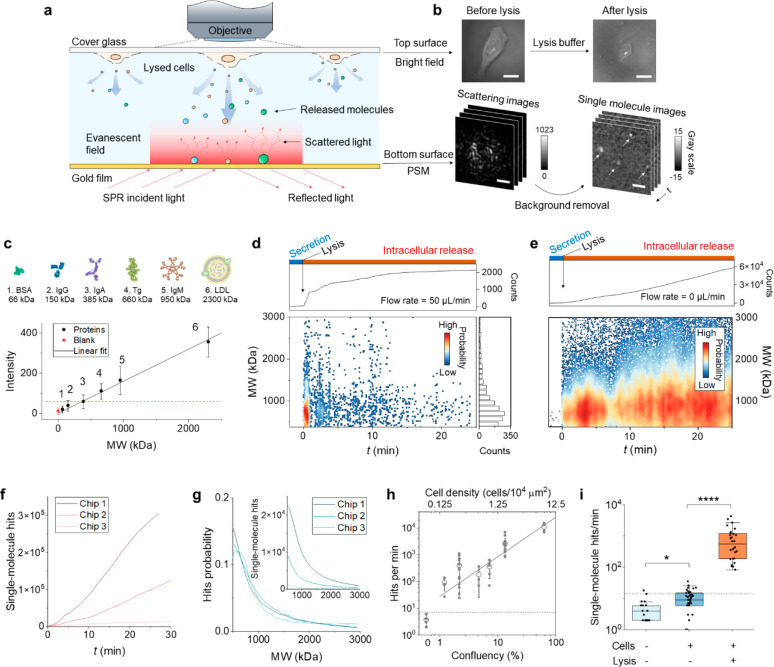
Figure 1.
Principle of single-protein imaging and cell lysis detection. (a) Experimental setup. Cells are cultured on the top glass surface of the flow chamber. After introducing lysis buffer, intracellular molecules are released and diffuse to the bottom gold film surface. An incident light is guided to the gold film by a prism to excite SPR on the surface. Single molecules hit the surface and scatter the light in the evanescent field, which is imaged by a CMOS camera via an objective above the chamber. (b) The top surface imaged in a bright field showing the morphology of a single cell before and after lysis. Scale bar, 15 μm. The bottom surface recorded in PSM mode shows the scattering of the surface. Single molecules are revealed after removing the background by differential imaging, where each bright spot indicated by the arrows is a single protein or complex molecule. Scale bar, 3 μm. (c) The conversion from scattered light intensity to molecular weight (MW) is calibrated using protein samples in PBS solution. Error bars represent the mean ± standard deviation (s.d.) obtained from >1000 single molecules. The blank sample is pure PBS solution, showing the system noise level. The red dashed line marks the detection limit of the PSM imaging technique, defined by mean + 3 × s.d. of the blank. (d) Temporal profile of the release of intracellular molecules during cell lysis. Lysis buffer was injected at t = 0 and flowed at 50 μL/min in the chamber. Top panel: cumulative single-molecule hits on the surface. Bottom left panel: mass distribution of single molecules over time after the lysis, where each point is from a single molecule. Bottom right panel: MW histogram obtained by projecting the single-molecule data. (e) Temporal profile of single-molecule hits without flow after cell lysis. The flow was stopped immediately after introducing lysis buffer. The cell confluences in (d) and (e) are 10 and 15%, respectively. (f) Cumulative single-molecule hits obtained from three sensor chips with random cell confluence. (g) Normalized mass distribution of released single molecules obtained from the three chips. The inset shows the original distribution. (h) Hitting rate as a function of confluency or cell density. The data are plotted in log–log scale and fitted linearly (solid line). Data within the same group were measured with one chip but using different regions of interest (ROIs). The 0 confluence was measured using a chip without cells. Error bars represent mean ± s.d. The dashed line marks mean + 2 × s.d. of the 0 confluency. (i) Control experiments using chips without cells or lysis buffer. From left to right: n = 17 (on 3 chips), 37 (on 7 chips), and 28 (on 8 chips). The dashed line shows mean + 2 × s.d. of the cell-free group. *P < 0.05; ****P < 0.0001.

