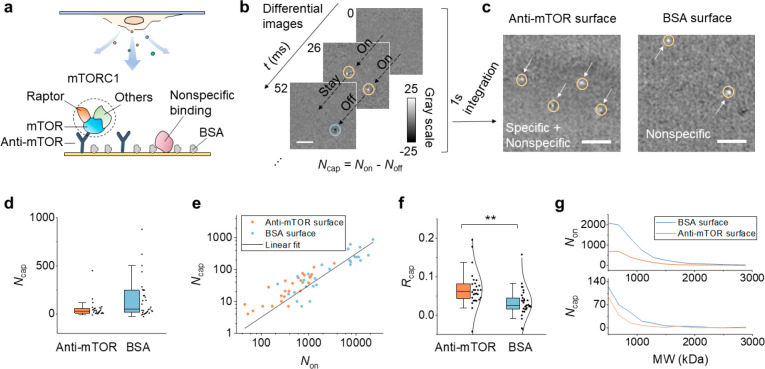
Figure 2.
Specific detection of released single mTORC1. (a) mTORC1, an intracellular protein complex consisting of mTOR, Raptor, and other components is specifically captured to the anti-mTOR functionalized surface. Although the surface is blocked with BSA, some large molecules can still bind to the surface nonspecifically and be imaged by PSM. (b) Representative differential images showing the dynamic binding and unbinding of single-protein complexes. Scale bar, 3 μm. The bright spot and the dark spot in the image indicate the molecule hitting or leaving the surface, respectively. The total number of captured molecules (Ncap) in a measurement is defined by Ncap = Non – Noff. (c) Integration of the differential images for 1 s. The arrows mark the position of the captured molecules. The left and right panels show the result of using an anti-mTOR surface and BSA surface, respectively. Scale bar, 3 μm. (d) The numbers of captured molecules on an anti-mTOR surface and BSA surface. Each data point is obtained from an individual measurement; n = 28 (on 9 chips) and 31 (on 10 chips) for the anti-mTOR and BSA groups, respectively. For each measurement, the cell confluence is random, and the detection time ranges from 30 s to 2 min. (e) The positive correlation between Ncap and Non. (f) Capture ratio (Rcap = Ncap/Non) is used to describe the binding ability, with anti-mTOR showing a significantly higher ratio than BSA. **P < 0.01. The data are fitted with a normal distribution (solid curves). (g) Representative mass distribution curves of released molecules (top) and captured molecules (bottom) for anti-mTOR and BSA surfaces.

