Figure 4.
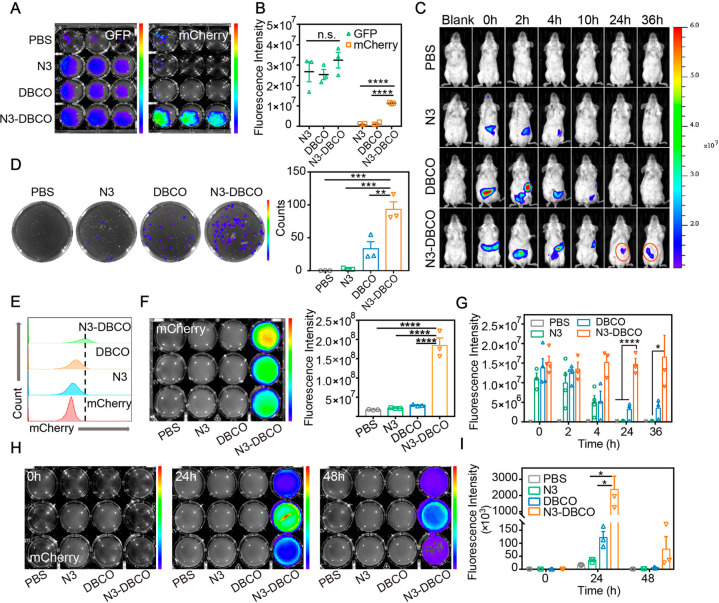
In vivo enhanced bacterial retention with bioorthogonal mediation. (A) Fluorescence imaging of GFP and mCherry in mouse feces after 20 h culture in LB medium. Mice in different groups were gavaged with N3-GFP, GFP + DBCO-mCherry, N3-GFP + DBCO-mCherry. Feces of mouse in different groups were collected 6 h after gavage (n = 3). (B) Quantitative analysis of GFP and mCherry fluorescence intensity in mice feces of different groups. (C) Representative IVIS images for evaluating bacterial retention in the GI tract of mice mediated by biorthogonal reactions (n = 3). (D) Bacterial colony-forming units of mCherry in LB agar plates for quantifying the number of mCherry in mice colon tissues. Fluorescence imaging of mCherry is shown on the plates. Quantitative analysis of fluorescence intensity is also shown on the right (n = 3). (E) Flow cytometry analysis for quantification of mCherry in mice colon tissues. (n = 3). (F) In vitro fluorescence imaging of mCherry in mice colon tissues after 20 h culture in LB medium. Quantitative analysis of mCherry fluorescence intensity is shown on the right (n = 3). (G) Quantitative analysis of in vivo mCherry fluorescence intensity at different time points. (H) Representative IVIS images of cultured mixture with feces for evaluating bacterial colonization over 48 h. Feces were collected at different time points after the gavage of mCherry (n = 3). (I) Quantification of fluorescence intensities. Significant differences were assessed in (B), (D), (F), (G), and (I) using one-way ANOVA (*P ≤ 0.05; **P ≤ 0.01; ***P ≤ 0.001; ****P ≤ 0.0001; n.s., not significant). The mean values and SEM are presented.

