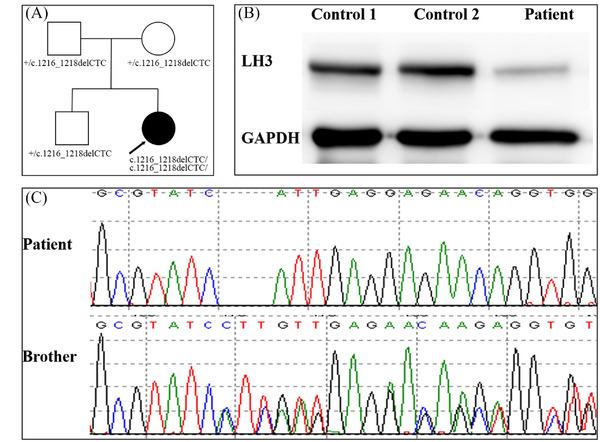
FIGURE 2.

Family pedigree and effect of the mutation on LH3 expression. (A) Family pedigree. The arrow indicates the proband. (B) LH3 protein level was analyzed by western blotting analysis from fibroblasts cells of the patient and the two healthy controls. (C) Sanger sequencing shows the c.1216_1218delCTC homozygous variant in PLOD3 in the patient and the heterozygous variant in her brother.
