
Figure 5. The succinate labelling pattern in portal plasma is similar to that in intestinal tissue while distinct from that in the cecal contents following gavage with U-C13-fructose.
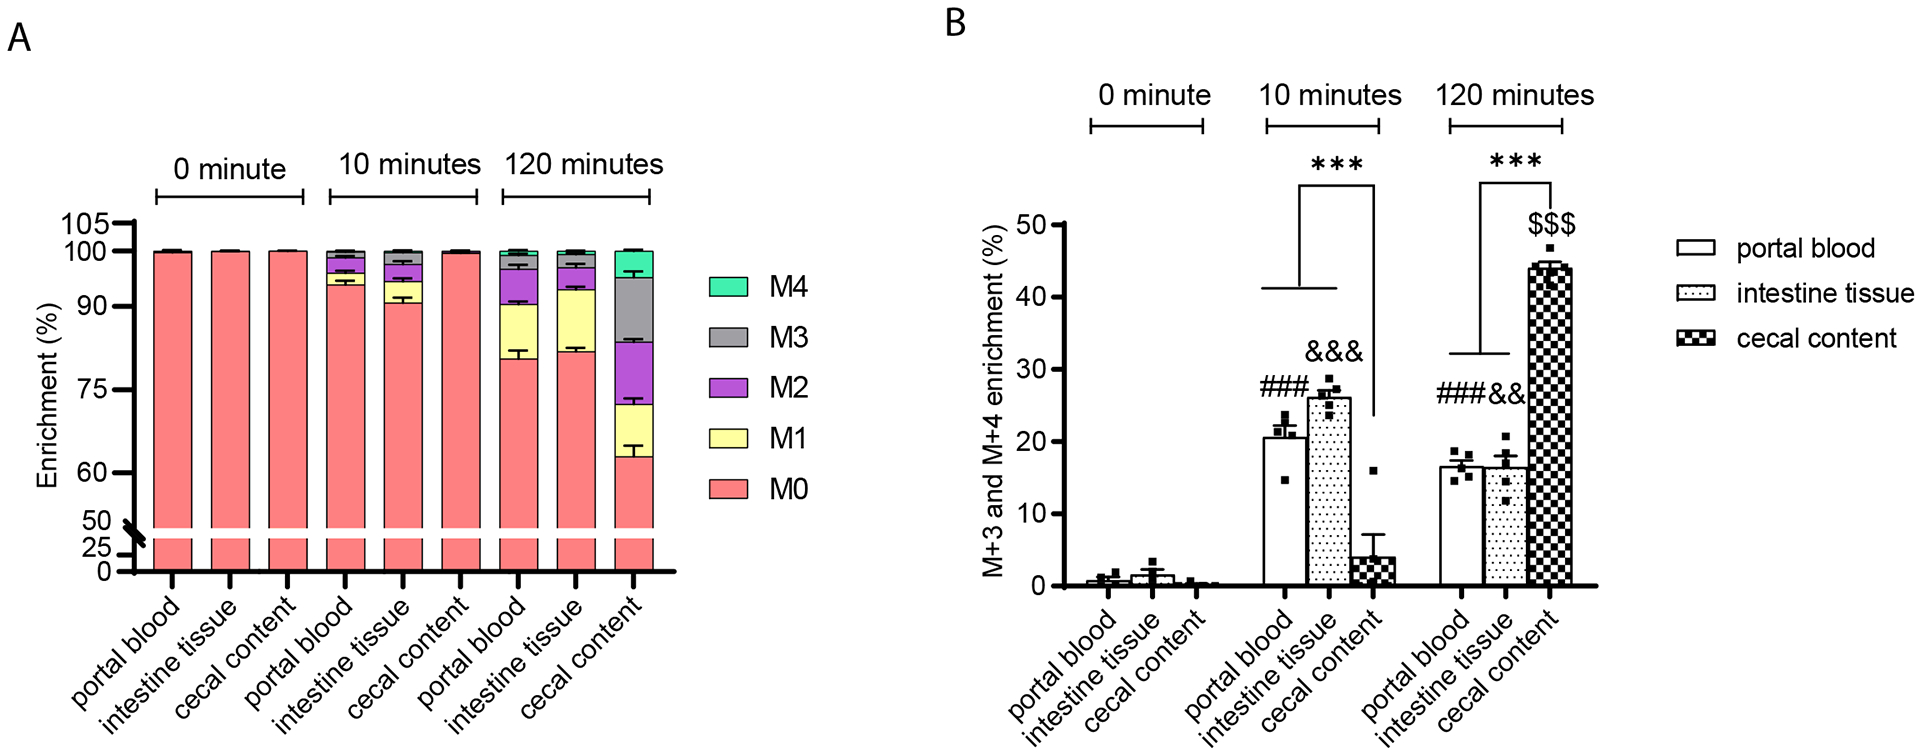
(A) The enrichment and (B) the ratio of M+3 plus M+4 to total labeled succinate in the portal plasma, intestinal tissue, and cecal contents after gavage of 8-weeks-old male mice with U-C13-fructose (4g/Kg body weight) (n=4 per group at each time point). Data represent means ± SEM. * p<0.05; ** p<0.01; *** p<0.001. Data were analyzed by two-way ANOVA and Tukey’s test was applied for post hoc comparisons. # portal plasma comparisons across time points, & intestinal tissue comparisons across time points, $ cecal content comparisons across time points, * comparisons between tissues within time points.