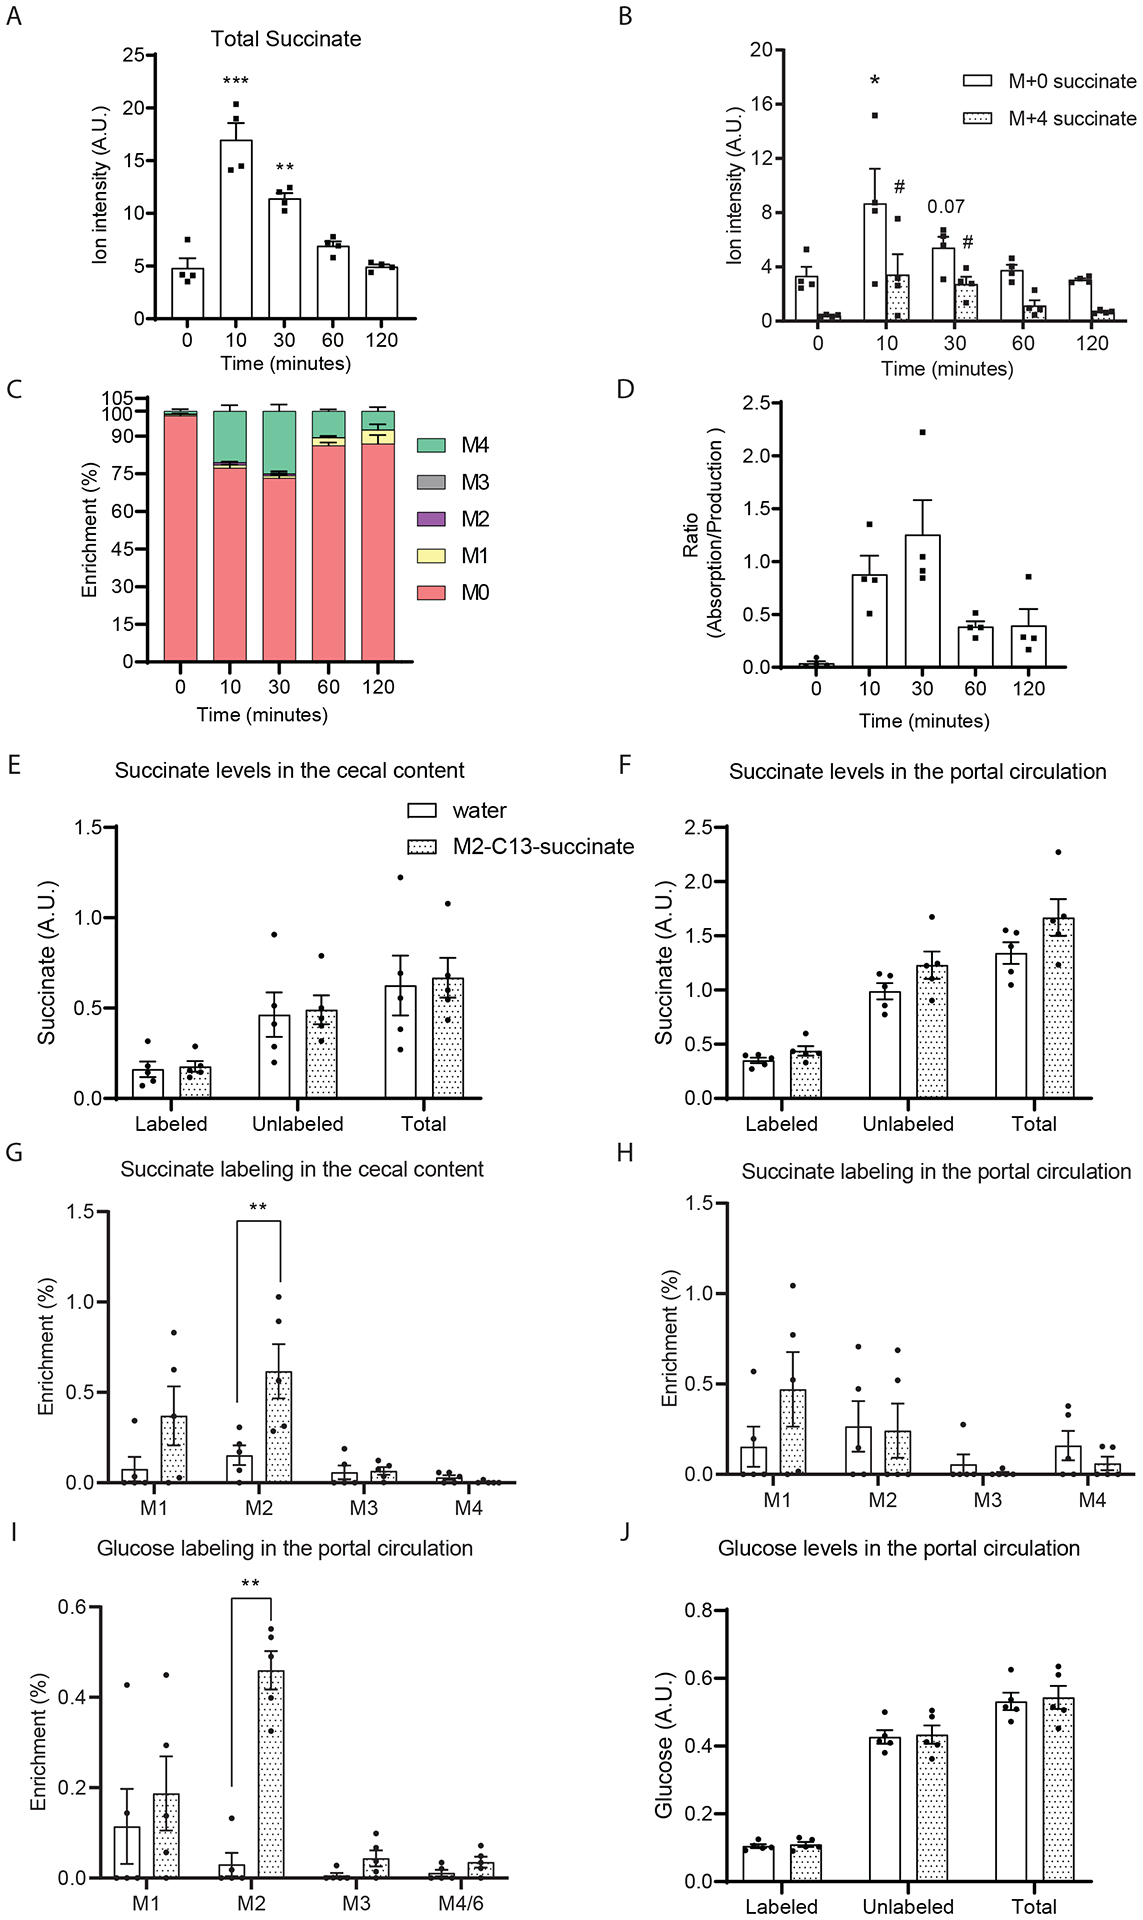
Figure 7. The intestinal absorption of succinate is limited.

(A) Total succinate ion counts and (B) M+0 and M+4 isotopomers ion counts and (C) enrichment in portal plasma after gavage of 1:1 D-4 succinate and unlabeled succinate (1.46 g sodium succinate/Kg body weight). Norvaline was used as internal standard. (D) The estimated ratio of intestinal absorption to endogenous production of succinate. (n=4 at each time point). Measured succinate levels (E, F) and labeling (G, H) in the cecal content and portal circulation after supplementing drinking water with 0.5% 2,3-C13-sodium succinate for 3 days. Glucose labeling (I) and quantification (J) were also measured by GC/MS. Data represent means ± SEM. * or # p<0.05; ** or ## p<0.01; *** or ### p<0.001. In panel A to D, data were analyzed by one-way ANOVA and Fisher’s LSD for post-hoc analysis between baseline (0 minutes) and time points post D4-succinate administration; In panel B, * indicates the comparison of M+0 succinate and # indicates the comparison of M+4 succinate with the zero-time point. In panel E to F, data were analyzed by two-way ANOVA and Tukey’s test was applied for post hoc comparison.
