Fig. 1.
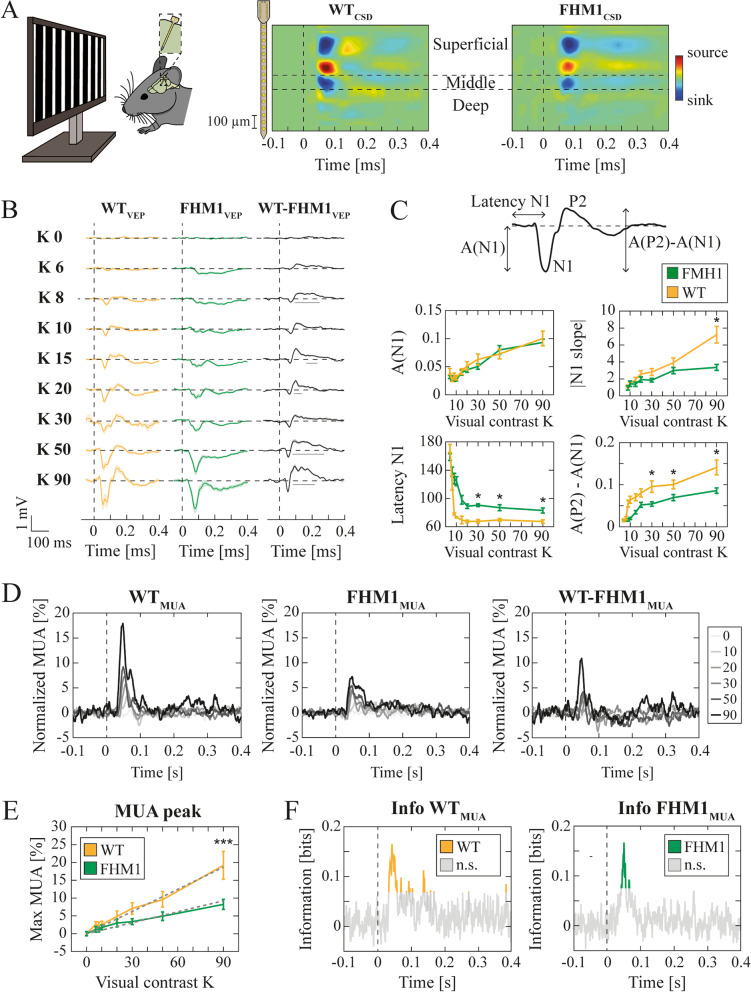
FHM1 mutations altered visual evoked potentials, decreased multi-unit activity but preserved information visual processing. A (left) Representative scheme of the experimental design. Square-wave 1 Hz alternating gratings at different contrast levels (K) were used for visual stimulation. A linear 16-channels probe (with 50 μm spacing between electrodes) was inserted into mice (n = 12 for WT; n = 12 for FHM1) V1. (right) Mean CSDs across animals aligned by the earliest current sink. B Mean VEPs across contrast levels K for WT (orange) and FHM1 (green) mice, and their difference (black). Solid horizontal lines indicate intervals of significant difference (permutation cluster-based test). Shaded regions indicate SEM. C (top) Schematic representation of the features extracted from the VEPs. (bottom) clockwise from top left to bottom right: amplitude of N1 [mV] (2WA: group F = 0.83; K F = 19.62; interaction F = 0.46); magnitude of the downslope of the first negative deflection of the VEPs [mV/s] (2WA: group F = 13.03; K F = 4.16; interaction F = 2.32); latency of N1 [ms] (2WA: group F = 175.78; K F = 28.56; interaction F = 4.63); amplitude difference between P2 and N1 [mV] (2WA: group F = 52.68; K F = 17.47; interaction F = 1.08). * p < 0.05 Dunn-Sidak post hoc test. D Normalized MUA of WT (left) and FHM1 (middle) mice and their difference (right) across contrast levels (in the legend). E Peak amplitude of normalized MUA of WT (orange) and FHM1 (green). 2WA K: F = 16.56; group: F = 12.98; interaction: F = 2.55. *** p < 0.001 Dunn-Sidak post hoc test. F Mutual information about contrast levels carried across time by the MUA of WT (left, orange) and FHM1 (right, green). Gray lines indicate non-significant (indicated as n.s. in the colorbar legend) MI (p > 0.05 bootstrap test)

