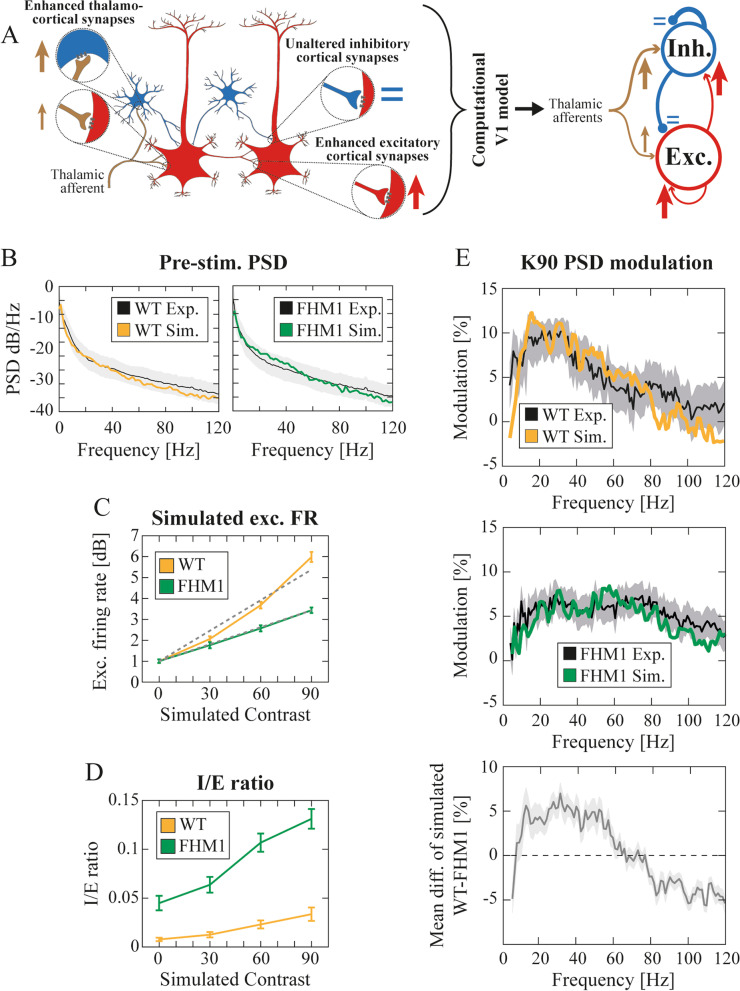
Fig. 3.
Spiking neuron network embedding the FHM1 synaptic alterations. A (left) Schematic representation of the synaptic alterations experimentally observed in [15, 16] (left) and implemented in our computational model (right). B Mean PSD of experimental and simulated LFPs for WT (left) and FHM1 (right) mice during pre-stimulus baseline. The shaded regions indicate the standard deviation of experimental PSDs. C Simulated normalized MUA of WT (orange) and FHM1 (green) model. D Inhibitory over excitatory ratio in the simulated WT (orange) and FHM1 (green) computational model across simulated K. 2WRMA, K: F > 1000; group: F > 1000; interaction: F = 646.2. E (top and middle) PSD modulation for the maximum contrast level (K = 90) of experimental (black) and simulated data for WT (orange, top) and FHM1 (green, middle). See also Fig. S1 A-B for responses to low contrasts. (bottom) Mean difference between the simulated WT and FHM1 spectral modulations (shaded error bar indicate standard deviation of bootstrapped mean difference)

