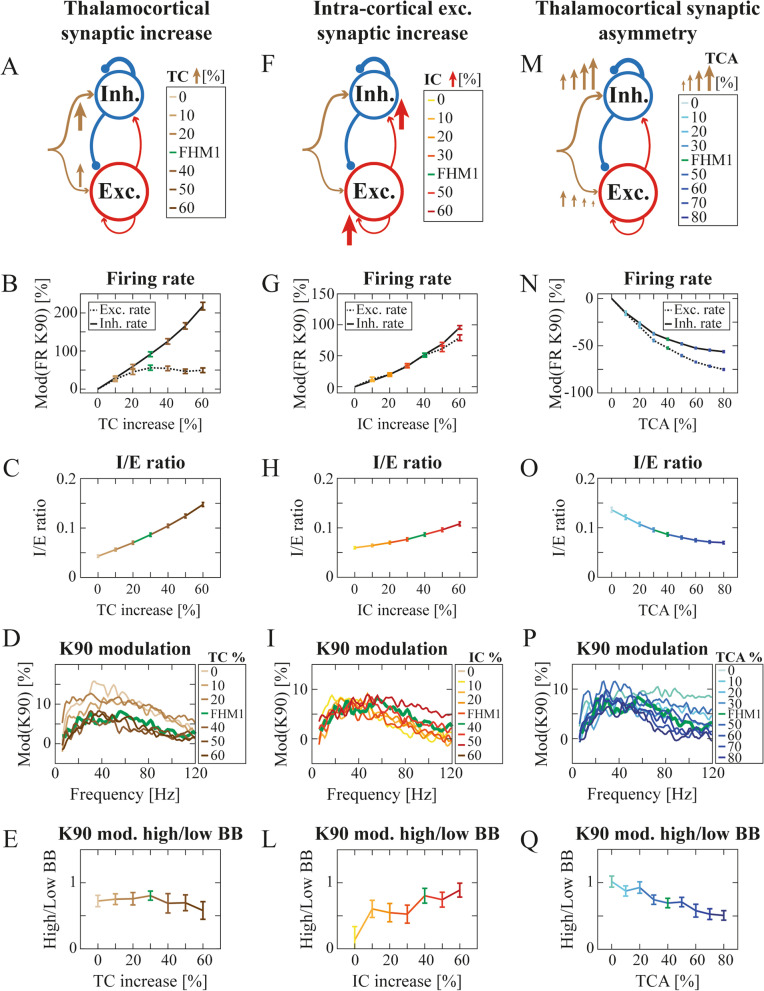
Fig. 4.
Cortico-cortical and thalamocortical gain-of-function and thalamocortical asymmetry differentially contributed to shaping cortical dynamics in FHM1 computational model. A Schematics of the FHM1 computational model when considering only the thalamocortical (TC) synaptic increase (represented by sand-colored arrows with thickness proportional to synaptic strength). B Modulation of excitatory (dashed black line) and inhibitory (black line) firing rate across TC synaptic increase levels (mean ± std). The modulation was computed with respect to the simulated pre-stimulation baseline firing rate. 2WRMA TC: F = 474.85; neuronal type: F = 25,579; interaction: F = 3291.9. See also Fig. S1 C. C Inhibitory over excitatory ratio (averaged across contrast levels) in the simulated excitatory neurons across TC increase levels (mean ± std). 2WRMA TC: F > 1000; K: F > 1000; interaction: F = 49.30. See also Figs. S1 F, I, S3 E. D PSD modulations of the simulated LFPs at K = 90 with respect to pre-stimulation across TC increase levels. E Ratio of high over low broad ɣ band of PSD modulation of simulated LFPs across TC increase levels. See also Fig. S3 B-D, F. F-L Same as (A-E) but across IC increase levels. G 2WRMA IC: F = 293.93; neuronal type: F > 1000; interaction: F = 614.09. See also Fig. S1 D. H 2WRMA K: F > 1000; IC: F = 585.83; interaction: F = 44.53. See also Fig. S1 G,L, S3 M. L See also Fig. S3 H-L, N. M-Q Same as (A-E) but across TCA levels. N 2WRMA TCA: F = 649.57; neuronal type: F > 1000; interaction: F = 251.39. See also Fig. S1 E. O 2WRMA TCA: F > 1000; K: F > 1000; interaction: F > 1000. See also Figs. S1 H, M, S3 S. Q See also Fig. S3 P-R, T

