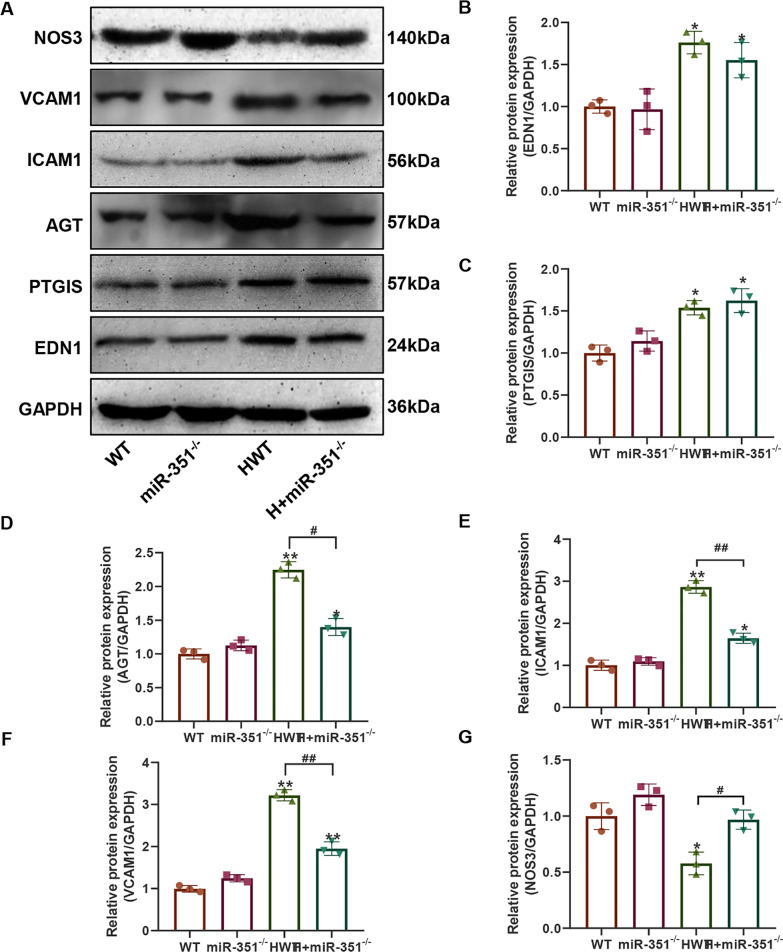
Fig. 4.
Western blot results of atherosclerotic-related proteins in miR-351KO mice. A Western blot detection results. B ImageJ quantified statistical results of the NOS3 band gray values. C ImageJ quantitative statistical results of the VCAM1 densitometry values. D ImageJ quantitative statistical results of the ICAM1 band gray values. E ImageJ quantitative statistical results of the AGT band gray values. F ImageJ quantitative statistical results of the PTGIS band gray values. G ImageJ quantitative statistical results of the EDN1 strip gray values. **P < 0.01, *P < 0.05, vs. the WT group. #P < 0.05 represents the comparison between the two groups of connections. N = 3 mice per group

