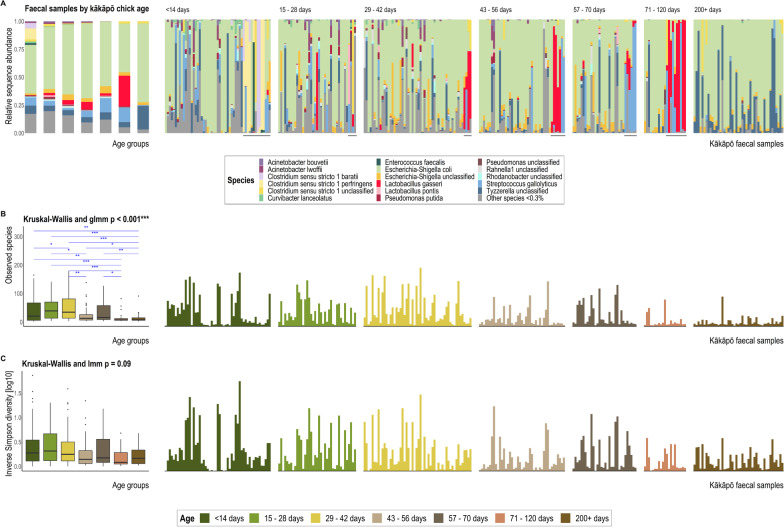
Fig. 4.
A 16S rRNA gene sequence-based taxonomic distribution of bacteria within age groups and individual kākāpō chick faecal samples at the species level. Bars on the aggregated graph (left) are in the same order as the sample-level profile age groups from left to right. Individual samples are ordered within age groups chronologically and alphabetically. Taxa with mean relative 16S rRNA gene sequence abundance < 0.3% are grouped as ‘Other species’. Underlined samples are those collected from chicks being hand reared at the time of collection. B Observed richness and C Inverse Simpson (plotted on a log10 scale) alpha-diversity indices for kākāpō chick faecal samples grouped by chick age. The y-axes for corresponding bar- and box-plots are identical. Significant Dunn’s test pairwise comparisons with Benjamini–Hochberg adjustment between age groups in the box plot are denoted by asterisks (*p < 0.05, **p < 0.01, ***p < 0.001). Both box- and bar- plots show a decrease in bacterial community diversity with increasing chick age. Box-plot details are as described for Fig. 3

