Fig. 4.
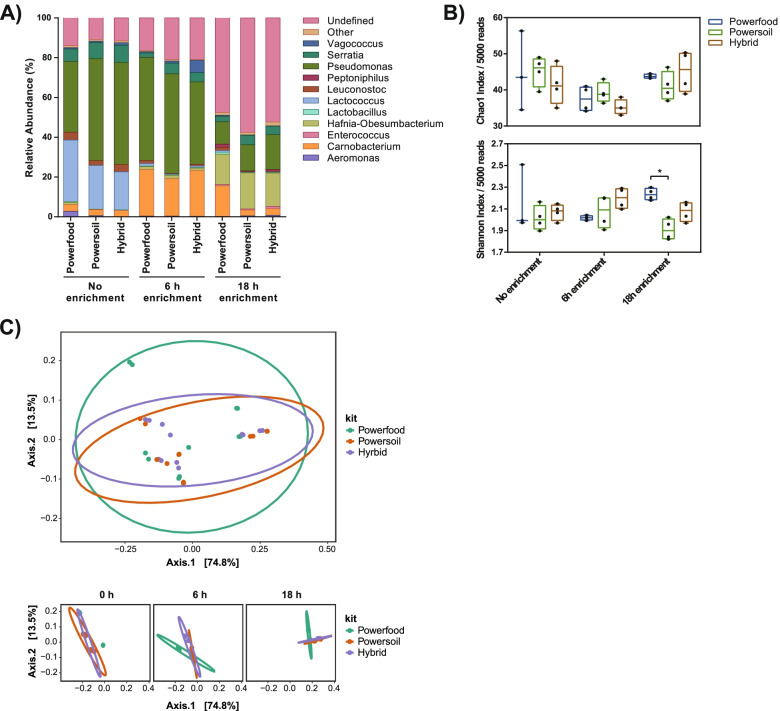
Relative abundances, alpha and beta diversities of DNA extraction kits at each enrichment time point. A Average relative abundances of genera are similar between DNA extraction kits at each time point. Taxa abundances of 16S rRNA sequences at the genus level are shown for each kit by sampling time point. Relative abundances are shown for genera > 1% in at least 1 sample. Undefined: OTUs that could not be identified down to the genus level; Other: OTUs present at < 1% were grouped and summed. B Genus diversity, but not richness, is altered by choice of DNA extraction kit. Chao1 index (upper panel) and Shannon index (lower panel) of chicken breast 16S rRNA microbiota by enrichment time point. Horizontal lines represent the median, boxes indicate the inter-quantile range and whiskers represent values within 1.5 IQR of the lower and upper quantiles. Alpha diversities were calculated using PhyloSeq in R. Asterisks denote statistically significant differences (P < 0.05) using t-tests. C Microbial composition is not altered by DNA extraction kit. Principal co-ordinate analysis of weighted Unifrac distances for all 16S rRNA samples (upper panel) and 16S rRNA samples by enrichment time (lower panel). Ellipses represent 95% confidence regions

