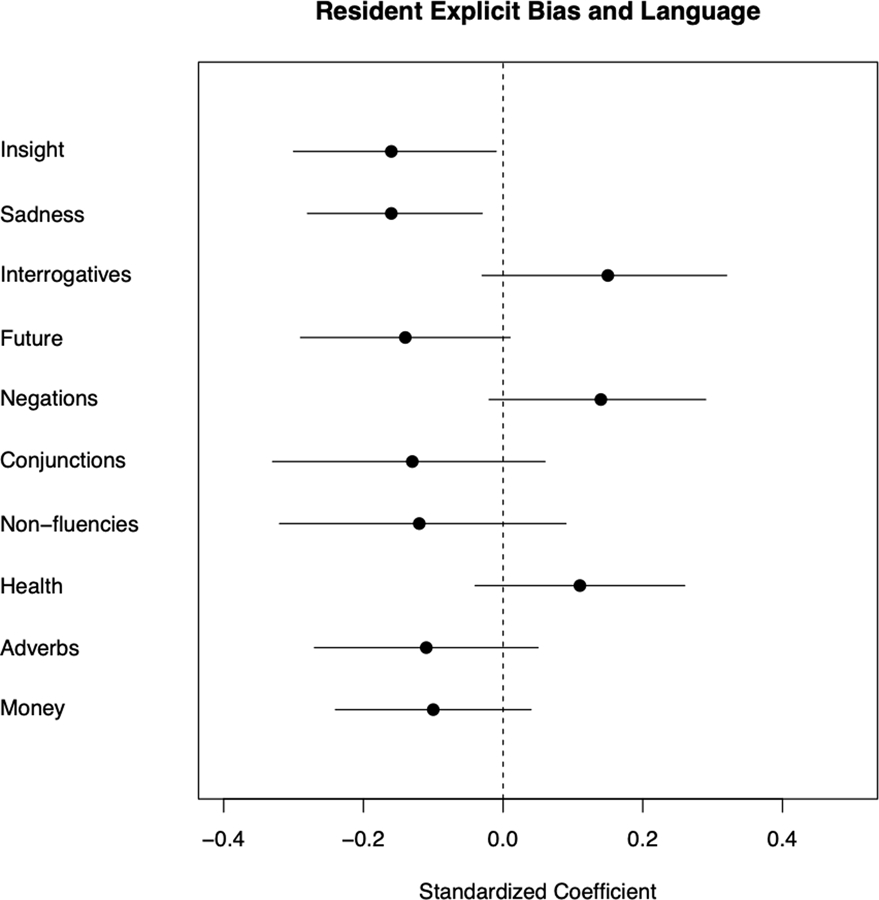
Figure 3.

Standardized coefficients for the 10 largest relationships between explicit bias and LIWC language categories. Dots represent the value of the standardized coefficient for the relationship between explicit bias and the indicated language category. Bars represent the 95% confidence interval.
