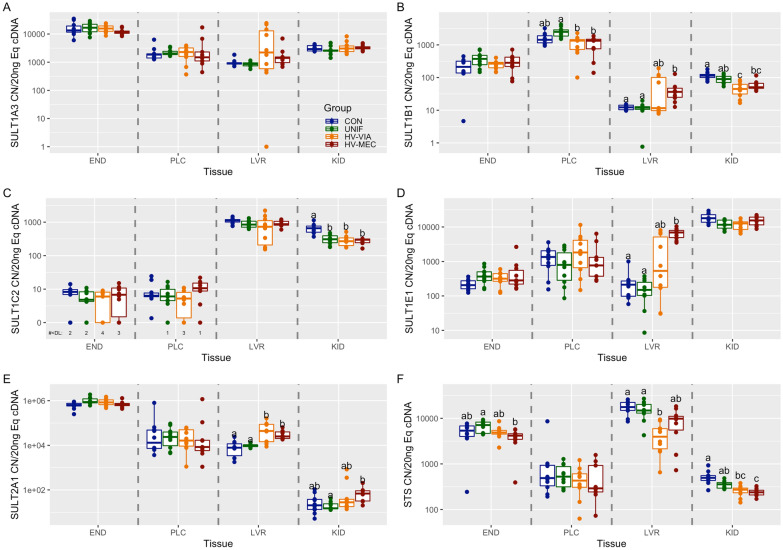
Figure 3.
Sulfotransferase gene expression. Transcriptional gene expression for SULT1A3 (A), SULT1B1 (B), SULT1C2 (C), SULT1E1 (D), SULT2A1 (E), and STS (F) in maternal endometrium (END), fetal placenta (PLC), fetal liver (LVR), and fetal kidney (KID) derived from fetuses of Sham inoculated control (CON, n = 10) and PRRSV-2 challenged dams at 21 days post maternal infection. Fetuses from challenged dams were classified based on serum and thymus viral load as being uninfected (UNIF, n = 10), high viral load viable (HV-VIA, n = 10), or high viral load with meconium staining (HV-MEC, n = 10). Gene expression was evaluated using a standard curve generated from plasmid and normalized as copy number per 20 ng of equivalent cDNA to quantify gene expression in each group in each tissue with different superscripts denoting statistical differences between groups (P < 0.05) within a given tissue.

